This page should be read in conjunction with How Plume Plotter Works. It provides more details specific to the Belfast version of Plume Plotter.
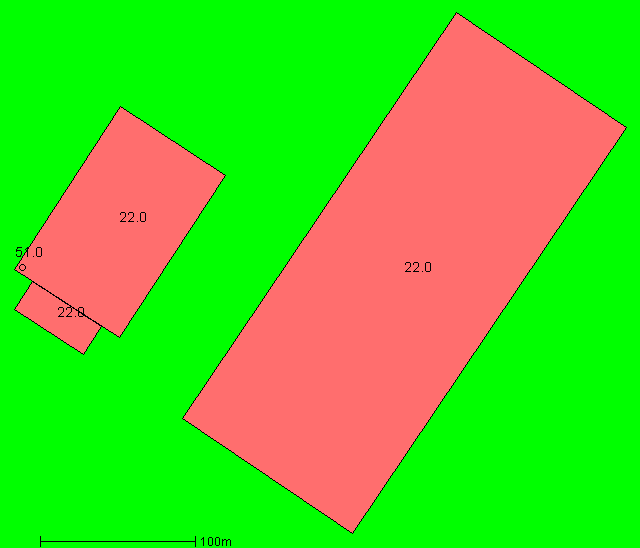
Building measurements are taken from [1]. This image shows the layout of the stack and building modelled. North is at the top; colours and numbers indicate the height of the buildings and the stack.
These are taken from [1]:
The following values are used for site characteristics. Roughness length is as specified in [1]:
The emission rates of pollutants are taken from [1]:
| Pollutant | Emission rate per second |
|---|---|
| Oxides of nitrogen | 6.783 g |
| Particulates | 399 mg |
| Sulphur dioxide | 1.995 g |
| Carbon monoxide | 1.995 g |
| TOC | 399 mg |
| Hydrogen chloride | 399 mg |
| Hydrogen flouride | 39.9 mg |
| Cadmium & Thallium | 2.1 mg |
| Mercury | 2.1 mg |
| Other metals | 21 mg |
| Ammonia | 201 mg |
| Dioxins and furans | 3.99 ng |
The background levels of pollutants are taken from [1]:
| Pollutant | Background concentration per m3 |
|---|---|
| Oxides of nitrogen | 16 μg |
| Particulates | 21 μg |
| Sulphur dioxide | N/A |
| Carbon monoxide | N/A |
| TOC | N/A |
| Hydrogen chloride | N/A |
| Hydrogen flouride | N/A |
| Cadmium & Thallium | 80 pg |
| Mercury | 1.59 ng |
| Other metals | 30.93 ng |
| Ammonia | N/A |
| Dioxins and furans | N/A |
Weather data is taken from METAR reports from a local airport: Belfast City.
Upper air data is the latest reported by the Castor Bay upper air station.
1. Combined Heat and Power Generating Station for the Treatment of RDF by Gasification -- Environmental Statement -- Air Quality Impact Assessment. The Airshed. March 2015. Planning application LA04/2015/0301/F.