This page should be read in conjunction with How Plume Plotter Works. It provides more details specific to the Cardiff version of Plume Plotter.
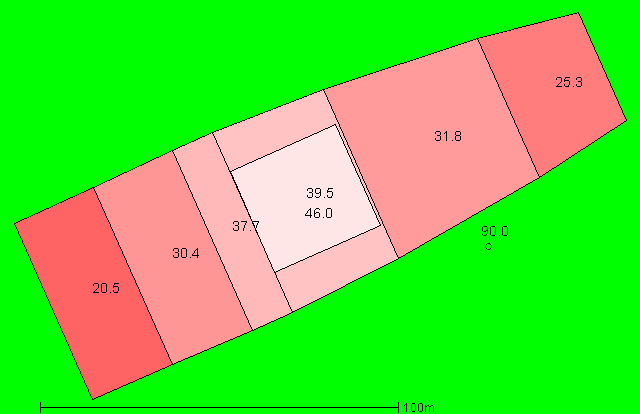
Building measurements are taken from [2]. This image shows the layout of the stack (actually two stacks but represented as one here) and building modelled. North is at the top; colours and numbers indicate the height of the buildings and the stack:
These are taken from [1]. Note that, because they are so close, the two stacks are combined into a single larger stack here:
The following values are used for albedo, Bowen ratio and roughness length. Roughness length is as specified in [1]:
The emission rates of pollutants are of two types. Both are calculated using the flow rate reported in [1], which is multiplied by the emission concentrations.
For the planned emission rates, the concentrations used are the IED limits, as stated in (e.g.) [1]. Resulting (mass per second) emission rates for the two stacks combined are listed below:
| Pollutant | Emission rate per second |
|---|---|
| Oxides of nitrogen | 14.96 g |
| Particulates | 748 mg |
| Sulphur dioxide | 3.74 g |
| Carbon monoxide | 3.74 g |
| Hydrogen chloride | 748 mg |
| Hydrogen flouride | 74.8 mg |
| TOC | 748 mg |
| Ammonia | 448 mg |
| Cadmium & Thallium | 3.74 mg |
| Mercury | 3.74 mg |
| Other metals | 37.4 mg |
| Dioxins and furans | 7.48 ng |
| PAHs | N/A |
| PCBs | N/A |
The actual emission rates use the annual average concentrations for 2017, as reported in the incinerator's annual report. They are listed below:
| Pollutant | Emission rate per second |
|---|---|
| Oxides of nitrogen | 13.34 g |
| Particulates | 37.4 mg |
| Sulphur dioxide | 688.2 mg |
| Carbon monoxide | 849 mg |
| Hydrogen chloride | 609.6 mg |
| Hydrogen flouride | 2.244 mg |
| TOC | 26.18 mg |
| Ammonia | 48.62 mg |
| Cadmium & Thallium | 123.4 μg |
| Mercury | 280 μg |
| Other metals | 1.833 mg |
| Dioxins and furans | 1.46 ng |
| PAHs | N/A |
| PCBs | N/A |
The background levels of pollutants are taken from [1]:
| Pollutant | Background concentration per m3 |
|---|---|
| Oxides of nitrogen | 13.9 μg |
| Particulates | 16.4 μg |
| Sulphur dioxide | 2.9 μg |
| Carbon monoxide | 354 μg |
| Hydrogen chloride | 260 ng |
| Hydrogen flouride | 3.5 μg |
| TOC | 490 ng |
| Ammonia | 900 ng |
| Cadmium & Thallium | 230 pg |
| Mercury | 2.3 ng |
| Other metals | 41.92 ng |
| Dioxins and furans | N/A |
| PAHs | N/A |
| PCBs | N/A |
Weather data is taken from METAR reports from a local airport: Cardiff.
Upper air data is the latest reported by the Camborne upper air station.