This page should be read in conjunction with How Plume Plotter Works. It provides more details specific to the Carlisle version of Plume Plotter.
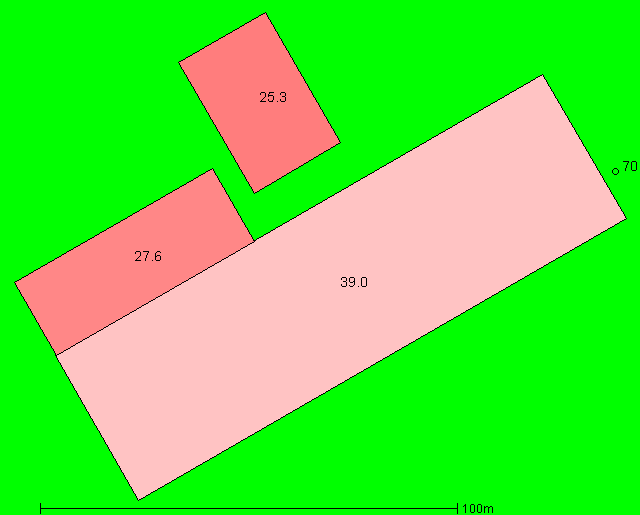
Building measurements are taken from [1]. This image shows the layout of the stack and buildings modelled. North is at the top; colours and numbers indicate the height of the buildings and the stack.
These are taken from [1]:
The following values are used for albedo, Bowen ratio and roughness length. Roughness length is as specified in [1]:
The emission rates of pollutants are taken from [1]:
| Pollutant | Emission rate per second |
|---|---|
| Oxides of nitrogen | 5.4 g |
| Sulphur dioxide | 1.35 g |
| Carbon monoxide | 2.25 g |
| Particulates | 225 mg |
| Hydrogen chloride | 270 mg |
| VOCs | 450 mg |
| Hydrogen flouride | 45 mg |
| Ammonia | 450 mg |
| Cadmium and Thallium | 900 μg |
| Mercury | 900 μg |
| Other metals | 13.5 mg |
| PAHs | 4.73 μg |
| Dioxins and furans | 2.7 ng |
| PCBs | 225 μg |
The background levels of pollutants are taken from [1]:
| Pollutant | Background concentration per m3 |
|---|---|
| Oxides of nitrogen | 13.5 μg |
| Sulphur dioxide | 2.98 μg |
| Carbon monoxide | 252 μg |
| Particulates | 11.65 μg |
| Hydrogen chloride | 710 ng |
| VOCs | 860 ng |
| Hydrogen flouride | 2.35 μg |
| Ammonia | 4.23 μg |
| Cadmium and Thallium | 38 pg |
| Mercury | 1.51 ng |
| Other metals | 7.38 ng |
| PAHs | 160 pg |
| Dioxins and furans | 33 fg |
| PCBs | 127.5 pg |
Wind speed, wind direction, temperature, pressure, and solar radiation are the latest values reported by one of two weather stations. If a value is not available from the primary weather station it is obtained from the secondary weather station. (Some weather stations do not measure solar radiation at all.) The primary weather station is and the secondary weather station is .
Upper air data is the latest reported by the Albemarle upper air station.
1. Kingmoor Energy Recovery Facility -- Air Quality Assessment. Fichtner Ltd. January 2020.