This page should be read in conjunction with How Plume Plotter Works. It provides more details specific to the Chineham version of Plume Plotter.
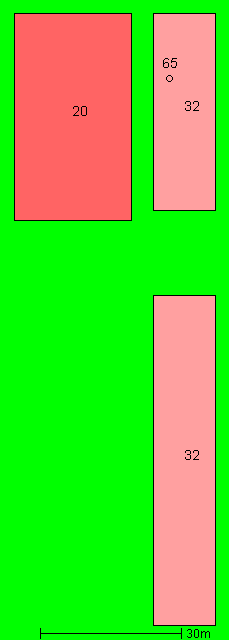
The image below shows the layout of all stacks and buildings modelled. North is at the top. Numbers show the heights of buildings and stacks, in metres. Higher buildings are a lighter shade of pink.
All of these are taken from [1]:
The following values are used for albedo, Bowen ratio, and roughness length:
The emission rates of pollutants are of two types. The planned emission rates are as given in [1]. They are listed below:
| Pollutant | Emission rate per second |
|---|---|
| Oxides of nitrogen | 3.23 g |
| Sulphur dioxide | 810 mg |
| Carbon monoxide | 810 mg |
| Particulates PM10 | 160 mg |
| Hydrogen chloride | 160 mg |
| Hydrogen flouride | 16 mg |
| TOC | 160 mg |
| Mercury | 810 μg |
| Cadmium and thallium | 810 μg |
| Other metals | 8.1 mg |
| Dioxins and furans | 1.61 ng |
The actual emission rates are the annual average for 2022, as reported in the incinerator's annual emissions report. They are listed below:
| Pollutant | Emission rate per second |
|---|---|
| Oxides of nitrogen | 2.726 g |
| Sulphur dioxide | 199 mg |
| Carbon monoxide | 94 mg |
| Particulates PM10 | 19 mg |
| Hydrogen chloride | 84 mg |
| Hydrogen flouride | 1.739 mg |
| TOC | 3 mg |
| Mercury | 38.6 μg |
| Cadmium and thallium | 25.9 μg |
| Other metals | 523 μg |
| Dioxins and furans | 233.5 pg |
The background levels of pollutants are taken from [1]. These are:
| Pollutant | Background concentration per m3 |
|---|---|
| Oxides of nitrogen | 22.75 μg |
| Sulphur dioxide | 7.225 μg |
| Carbon monoxide | 1.72 μg |
| Particulates PM10 | 18.2 μg |
| Hydrogen chloride | 436 ng |
| Hydrogen flouride | N/A |
| TOC | N/A |
| Mercury | 4.862 ng |
| Cadmium and thallium | 295 pg |
| Other metals | 55.7 ng |
| Dioxins and furans | 23.8 fg |
Weather data is taken from METAR reports from a local airport: Farnborough.
Upper air data is the latest reported by the Herstmonceux upper air station.
1. Integra North Energy Recovery Facility, September 2001. Document, Emissions, Background monitoring.
2. Integra North Energy Recovery Facility Annual Performance Report 2016.