This page should be read in conjunction with How Plume Plotter Works. It provides more details specific to the Lakeside version of Plume Plotter.
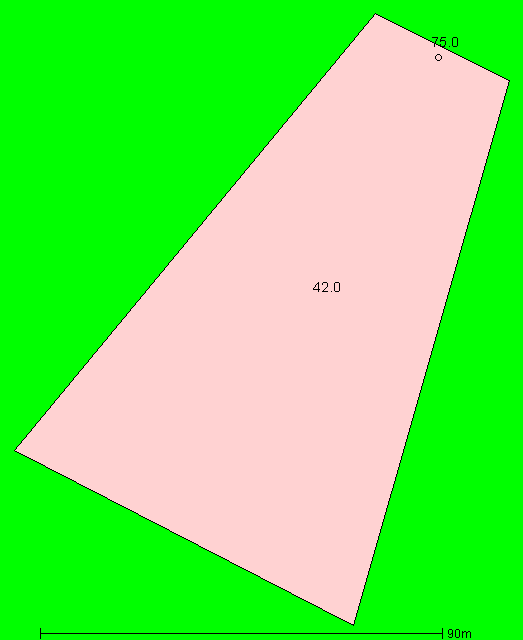
Building measurements are taken from drawings in the planning application [1] and from aerial photos. This image shows the layout of the stack and building modelled. North is at the top; colours and numbers indicate the height of the building and the stack:
Most of these are taken from [3], except stack location which comes from aerial photos. Note that the two flues (diameter 2.08m each) are combined into a single larger stack here:
The following values are used for albedo, Bowen ratio and roughness length. Roughness length is as specified in [1]:
The emission rates of pollutants are of two types. Both are calculated using the actual flow rate reported in [3], which is multiplied by the emission concentrations.
For the planned emission rates, the concentrations used are the IED limits, as stated in (e.g.) [1]. Resulting (mass per second) emission rates for each of the two flues are listed below:
| Pollutant | Emission rate per second |
|---|---|
| Oxides of nitrogen | 8.49 g |
| Particulates | 424.5 mg |
| Sulphur dioxide | 2.123 g |
| Carbon monoxide | 2.123 g |
| Hydrogen chloride | 424.5 mg |
| Hydrogen flouride | 84.9 mg |
| VOC | 424.5 mg |
| Ammonia | N/A |
| Mercury | 2.123 mg |
| Cadmium and thallium | 2.123 mg |
| Other metals | 21.23 mg |
| Dioxins and furans | 4.25 ng |
The actual emission rates use the annual average concentrations for 2016, as reported in [2]. They are listed below:
| Pollutant | Emission rate per second |
|---|---|
| Oxides of nitrogen | 6.524 g |
| Particulates | 38.84 mg |
| Sulphur dioxide | 89.57 mg |
| Carbon monoxide | 139.9 mg |
| Hydrogen chloride | 74.92 mg |
| Hydrogen flouride | 22.92 mg |
| VOC | 24.41 mg |
| Ammonia | 7.217 mg |
| Mercury | 38 μg |
| Cadmium and thallium | 25 μg |
| Other metals | 1.397 mg |
| Dioxins and furans | 360 pg |
The background levels of pollutants are taken from the planning application for the South London incinerator (until more local data can be found). These are:
| Pollutant | Background concentration per m3 |
|---|---|
| Oxides of nitrogen | 30 μg |
| Particulates | 25 μg |
| Sulphur dioxide | 3.5 μg |
| Carbon monoxide | 205 μg |
| Hydrogen chloride | 1 μg |
| Hydrogen flouride | 500 ng |
| VOC | 650 ng |
| Ammonia | 3 μg |
| Mercury | 2 ng |
| Cadmium and thallium | N/A |
| Other metals | N/A |
| Dioxins and furans | 8 fg |
Weather data is taken from METAR reports from a local airport: London Heathrow.
Upper air data is the latest reported by the Herstmonceux upper air station.
1. Lakeside EFW Environmental Statement: Air Quality Impact Assessment. S Grundon Waste Ltd. July 1999.
2. Annual Performance Report For Lakeside EFW Ltd. Permit EA/EPR/BT7116IW/V002. 2016.
3. Assessment of particulate emissions from energy-from-waste plant. Ricardo AEA. October 2015.