This page should be read in conjunction with How Plume Plotter Works. It provides more details specific to the Newhaven version of Plume Plotter.
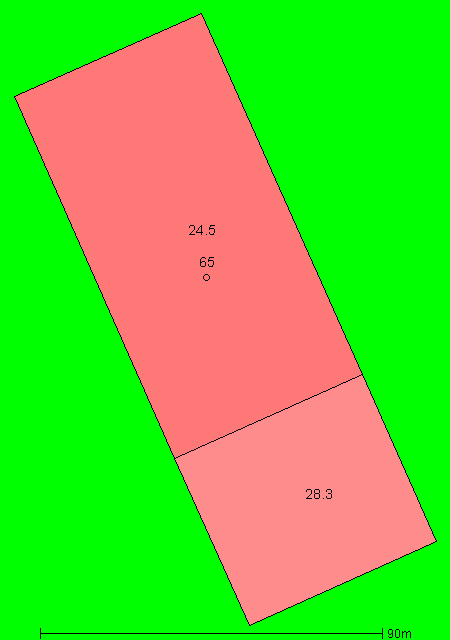
Building measurements are taken from [1]. This image shows the layout of the stack and buildings modelled. North is at the top; colours and numbers indicate the height of the buildings and the stack.
These are taken from [1]:
The following values are used for albedo, Bowen ratio and roughness length. None of these are specified in [1]:
The emission rates of pollutants are of two types. Both are calculated using the actual flow rate reported in [1], which is multiplied by the emission concentrations. (Note: the given flow rate is stated to be "per stack" but it must actually be for both stacks combined.)
For the planned emission rates, the concentrations used are the IED limits, as stated in (e.g.) [1] (but there is an error in [1] for the dioxins concentration; the correct value has been used). Resulting (mass per second) emission rates for the two stacks combined are listed below:
| Pollutant | Emission rate per second |
|---|---|
| Oxides of nitrogen | 8.16 g |
| Particulates | 408 mg |
| Sulphur dioxide | 2.04 g |
| Carbon monoxide | 2.04 g |
| Hydrogen chloride | 408 mg |
| Hydrogen flouride | 40.8 mg |
| VOCs | 408 mg |
| Cadmium & Thallium | 2.04 mg |
| Mercury | 2.04 mg |
| Other metals | 20.4 mg |
| Dioxins and furans | 4.08 ng |
The actual emission rates use the annual average concentrations for 2016, as reported in the incinerator's annual report and on [2]. They are listed below:
| Pollutant | Emission rate per second |
|---|---|
| Oxides of nitrogen | 7.67 g |
| Particulates | 57.12 mg |
| Sulphur dioxide | 0 |
| Carbon monoxide | 142.8 mg |
| Hydrogen chloride | 159.1 mg |
| Hydrogen flouride | 1.404 mg |
| VOCs | 8.16 mg |
| Cadmium & Thallium | 39.58 μg |
| Mercury | 97.51 μg |
| Other metals | 2.036 mg |
| Dioxins and furans | 285.6 pg |
The background levels of pollutants are taken from a later air quality assessment for the same location [3]:
| Pollutant | Background concentration per m3 |
|---|---|
| Oxides of nitrogen | 12 μg |
| Particulates | 13.5 μg |
| Sulphur dioxide | N/A |
| Carbon monoxide | N/A |
| Hydrogen chloride | N/A |
| Hydrogen flouride | N/A |
| VOCs | N/A |
| Cadmium & Thallium | N/A |
| Mercury | N/A |
| Other metals | N/A |
| Dioxins and furans | N/A |
Weather data is taken from METAR reports from a local airport: Shoreham.
Upper air data is the latest reported by the Herstmonceux upper air station.
1. Updated Air Quality Impact Assessment for Newhaven ERF. ERM. October 2010.
2. Veolia South Downs Emissions.
3. Newhaven Depot Air Quality Assessment. WYG. February 2018.