Methods
The plume dilution method
Emissions from incinerators are potentially hazardous to helicopters for three reasons, reported by Porter [2]: the temperature is too high (should be below 50°C), the vertical velocity is too high (should be below 4.3m/s), and the oxygen content is too low (should be above 12%).
In an early report [1], Porter presents a simple plume dilution method for estimating the temperature and oxygen content of an exhaust plume from the concentration of a pollutant in the plume (c) relative to its concentration when emitted from the stack (e). Porter uses a normalised (not actual) concentration for e. The plume dilution method is used again in a later report [2] to calculate oxygen content.
The temperature T can be calculated by:
T = Ta + (c/e)(Te – Ta)
where Ta is the ambient temperature and Te is the temperature of the emissions. For the Ringaskiddy incinerator, Te = 145°C and Porter [1] conservatively assumes Ta = 30°C.
Similarly, the oxygen content O can be calculated by:
O = Oa + (c/e)(Oe – Oa)
where Oa is the ambient oxygen content and Oe is the oxygen content of the emissions. For the Ringaskiddy incinerator, Oe = 6% [2] and Oa = 20.95%.
Solving T < 50°C using the equation for T gives this constraint on the relative concentration (c/e):
c/e < 0.174
while solving O > 12% using the equation for O gives:
c/e < 0.6
Our experiments
We used Porter's plume dilution method to estimate the temperature and the oxygen content of the Ringaskiddy incinerator emissions. Emissions were modelled for every hour of 2015 using AERMOD, based on hourly weather from Roches Point (an official Met Éireann weather station nearby) with cloud cover data from Cork Airport and upper air data from Valentia. A 3-dimensional receptor grid was defined around the top of the stack with 1-metre receptor spacing.
Although any pollutant can be used, we chose to model NOx, whose (normalised) emission concentration (e) is 200μg/m3. The critical concentration for temperature hazard is then 34.8μg/m3, because
c/e = 34.8/200 = 0.174
while for oxygen deficit hazard it is 120μg/m3, because
c/e = 120/200 = 0.6
The maximum concentration of NOx was recorded at each receptor. A 3-dimensional contour was plotted around the points with a concentration greater than 34.8μg/m3 (temperature) or 200μg/m3 (oxygen deficit).
Comparison with Porter's results
Porter [1] introduces the plume dilution method and uses it to estimate temperature and oxygen content using AERMOD. However, he does not use it to find out the extent of the risk zone but to confirm the size of the risk zone estimated by another (non-site specific) method. A 3-dimensional receptor grid was used, but the receptor spacing is not stated and the lowest receptor was apparently 100m above ground. In particular, the horizontal distance between the stack and nearest receptor is not stated. The greatest relative concentration reported is 1/24 but this is 30m above the stack and "very near" it horizontally; the concentrations at lower heights or closer to the stack are not stated.
Porter [2] again uses the plume dilution method to estimate oxygen content, but this time using ADMS (instead of AERMOD) and a receptor grid with 2-metre spacing. The receptor grid used is 2-dimensional "at various heights", but these heights are not stated, so it is unclear whether there are unobserved higher concentrations at other heights. Using this (partially specified) grid, the emissions are modelled over a period of several years and the maximum concentrations recorded. The risk zone (where the relative concentration is more than 0.6) is reported to extend no more than 3.5m from the stack. However, this is a horizontal distance. Nothing is said about the vertical extent of the risk zone.
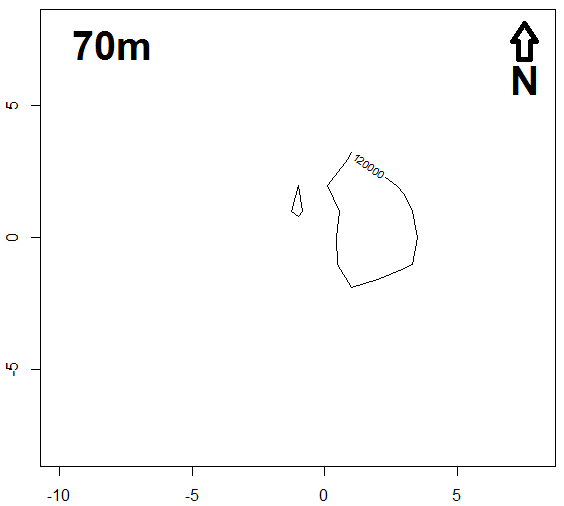
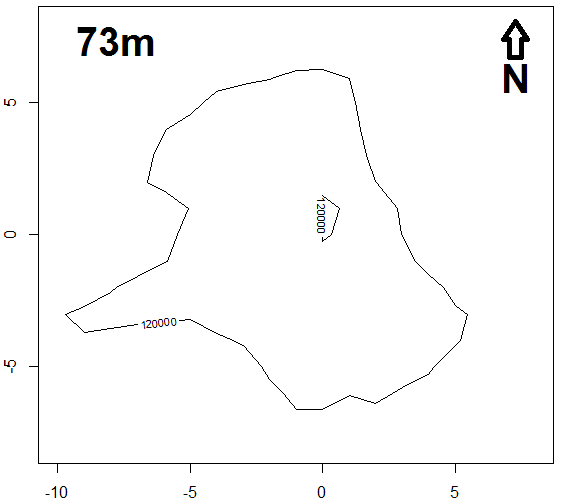
It is worth noting that our modelling using AERMOD (for 2015 only) agrees that the oxygen risk zone (where the relative concentration is more than 0.6) extends to about 3.5m (horizontally) from the stack, at the height of the top of the stack. However, it extends to about 10m from the stack at a level 3 metres higher, and extends vertically to 40m above the stack, as shown here. Here are our cross-sections of the oxygen deficit risk zone at 70m and 73m above the ground (axes show the number of metres east and north of the stack):
In Ref. 2, Porter uses a different method to estimate plume temperature, but does not explain why plume dilution was not used, as in Ref. 1. Porter's new method, using proprietary software, finds a 3.5m (horizontal) risk zone for temperature, but the vertical extent is again not stated. Our modelling, using plume dilution, found a maximum horizontal extent of more than 30m and a height of 61m, as shown here.
Finally, our experiments were performed using AERMOD, as used by Porter [1]. We used the parameters given in the original EIS [3]. It is strange that Porter [2] uses ADMS instead with no justification for the change and without stating the parameters used.
A more detailed critique of Porter's results [1, 2] appears in Ref. 4.
References
4. Comments on Proposed Waste to Energy Facility, Ringaskiddy, Co. Cork, PL04.PA0045. Mike Griew. 2017.