This page should be read in conjunction with How Plume Plotter Works. It provides more details specific to the Rivenhall version of Plume Plotter.
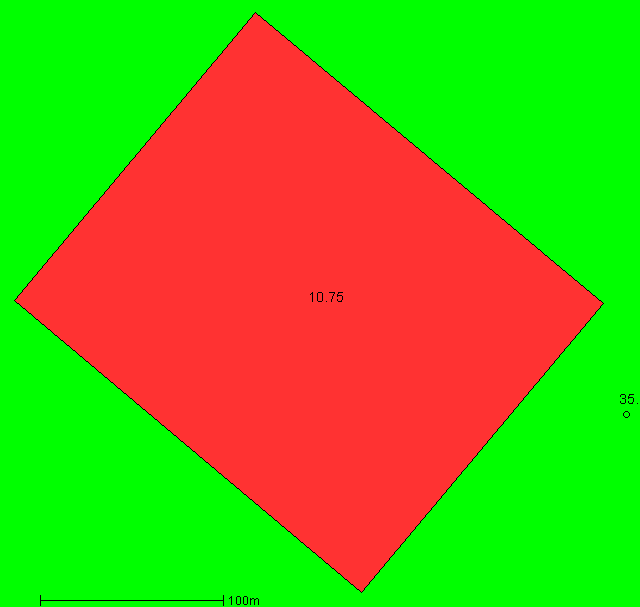
Building measurements are taken from [3]. This image shows the layout of the stack and buildings modelled. North is at the top; colours and numbers indicate the height of the buildings and the stack.
All of these are taken from [3] as modified by [2]:
The following values are used for albedo, Bowen ratio, and roughness length. Roughness length is as specified in [3]:
The emission rates of pollutants are taken from [3] as modified by [2]. These are:
| Pollutant | Emission rate per second |
|---|---|
| Oxides of nitrogen | 10.31 g |
| Sulphur dioxide | 5.156 g |
| Carbon monoxide | 5.156 g |
| Particulates | 1.032 g |
| Hydrogen chloride | 1.032 g |
| VOCs | 1.032 g |
| Hydrogen flouride | 104 mg |
| Ammonia | 1.032 g |
| Cadmium and thallium | 2.062 mg |
| Mercury | 5.156 mg |
| Other metals | 51.56 mg |
| Benzo(a)pyrene | 10.83 μg |
| Dioxins and furans | 10.31 ng |
| PCBs | 516 μg |
The background levels of pollutants are taken from [3]. These are:
| Pollutant | Background concentration per m3 |
|---|---|
| Oxides of nitrogen | 18.6 μg |
| Sulphur dioxide | 6.2 μg |
| Carbon monoxide | 301 μg |
| Particulates | 20.2 μg |
| Hydrogen chloride | 720 ng |
| VOCs | 600 ng |
| Hydrogen flouride | 2.35 μg |
| Ammonia | 1.8 μg |
| Cadmium and thallium | 150 pg |
| Mercury | 1.51 ng |
| Other metals | 16.51 ng |
| Benzo(a)pyrene | 140 pg |
| Dioxins and furans | 22.82 fg |
| PCBs | 141.5 pg |
Weather data is taken from METAR reports from a local airport: Stansted.
Upper air data is the latest reported by the Herstmonceux upper air station.
1. GENT FAIRHEAD & CO: RIVENHALL DISPERSION MODELLING ASSESSMENT, Fichtner, July 2015.
3. GENT FAIRHEAD & CO: RIVENHALL DISPERSION MODELLING ASSESSMENT, Fichtner, May 2017.