This page should be read in conjunction with How Plume Plotter Works. It provides more details specific to the Sheffield version of Plume Plotter.
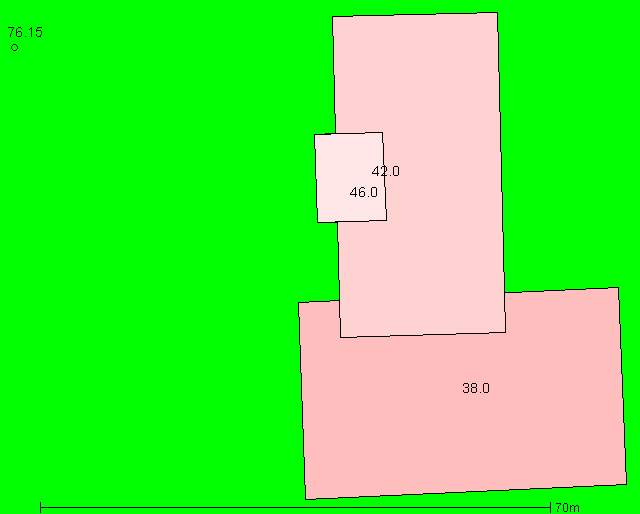
The image below shows the layout of all stacks and buildings modelled. North is at the top. Numbers show the heights of buildings and stacks, in metres. Higher buildings are a lighter shade of pink.
The details of the stack (from [1]) are:
The following values are used for albedo, Bowen ratio, and roughness length. The roughness length was set to 1m instead of the 1.5m specified in [1]:
The emission rates of pollutants are of two types. The planned emission rates are as given in [1]. They are listed below:
| Pollutant | Emission rate per second |
|---|---|
| Oxides of nitrogen | 6.975 g |
| Particulates | 388 mg |
| Sulphur dioxide | 1.94 g |
| VOCs | 388 mg |
| Carbon monoxide | 1.94 g |
| Hydrogen chloride | 388 mg |
| Hydrogen flouride | 38.8 mg |
| Ammonia | N/A |
| Cadmium and thallium | 1.94 mg |
| Mercury | 1.94 mg |
| Other metals | 19.4 mg |
| Dioxins and furans | 3.88 ng |
| PAHs | N/A |
| PCBs | N/A |
The actual emission rates are the annual average for 2015, as reported in [2]. They are listed below:
| Pollutant | Emission rate per second |
|---|---|
| Oxides of nitrogen | 4.435 g |
| Particulates | 64.44 mg |
| Sulphur dioxide | 500.6 mg |
| VOCs | 0 |
| Carbon monoxide | 148.7 mg |
| Hydrogen chloride | 250.3 mg |
| Hydrogen flouride | 3.683 mg |
| Ammonia | 0 |
| Cadmium and thallium | 34.12 μg |
| Mercury | 80.64 μg |
| Other metals | 585.4 μg |
| Dioxins and furans | 232.6 pg |
| PAHs | 8.634 μg |
| PCBs | 38.77 pg |
The background levels of pollutants are not given in [1]. Therefore, the first five have been taken from [3] (for the incinerator location); cadmium and group 3 metals are the monitored totals for Sheffield Tinsley for 2015 ([4]); and the rest are unknown:
| Pollutant | Background concentration per m3 |
|---|---|
| Oxides of nitrogen | 27.6 μg |
| Particulates | 13.9 μg |
| Sulphur dioxide | 2.94 μg |
| VOCs | 842 ng |
| Carbon monoxide | 237 μg |
| Hydrogen chloride | N/A |
| Hydrogen flouride | N/A |
| Ammonia | N/A |
| Cadmium and thallium | 445 pg |
| Mercury | N/A |
| Other metals | 111 ng |
| Dioxins and furans | N/A |
| PAHs | N/A |
| PCBs | N/A |
Wind speed, wind direction, temperature, pressure, and solar radiation are the latest values reported by one of two weather stations. If a value is not available from the primary weather station it is obtained from the secondary weather station. (Some weather stations do not measure solar radiation at all.) The primary weather station is and the secondary weather station is .
Upper air data is the latest reported by the Nottingham upper air station.
1. Original air quality assessment (unknown title, date, etc.).
2. Annual Performance Report 2015: Sheffield Energy Recovery Facility.