This page should be read in conjunction with How Plume Plotter Works. It provides more details specific to the Shepperton Gasifier version of Plume Plotter.
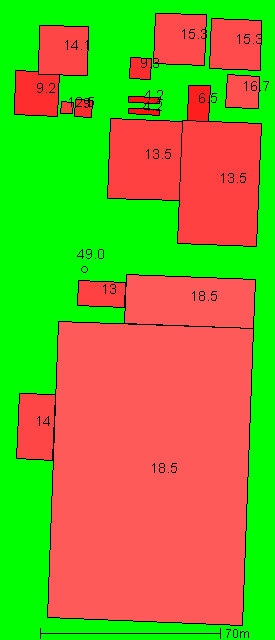
Building measurements are taken from [1]. This image shows the layout of the stack and buildings modelled. North is at the top; colours and numbers indicate the heights of the buildings and the stack:
All of these are taken from [1]:
The following values are used for albedo, Bowen ratio, and roughness length. Roughness length is as specified in [1]:
The emission rates of pollutants are taken from [1]. These are:
| Pollutant | Emission rate per second |
|---|---|
| Oxides of nitrogen | 928 mg |
| Sulphur dioxide | 464 mg |
| Particulates | 92.8 mg |
| Carbon monoxide | 464 mg |
| Hydrogen chloride | 92.8 mg |
| Hydrogen flouride | 9.28 mg |
| TOC | 92.8 mg |
| Ammonia | 92.8 mg |
| Cadmium and thallium | 464 μg |
| Mercury | 464 μg |
| Other metals | 4.64 mg |
| Benzo(a)pyrene | 928 ng |
| Dioxins and furans | 928 pg |
| PCBs | 46.4 μg |
The background levels of pollutants are taken from [1]. These are:
| Pollutant | Background concentration per m3 |
|---|---|
| Oxides of nitrogen | 37.6 μg |
| Sulphur dioxide | 4.39 μg |
| Particulates | 24.1 μg |
| Carbon monoxide | 470 μg |
| Hydrogen chloride | 530 ng |
| Hydrogen flouride | 2.35 μg |
| TOC | 1.07 μg |
| Ammonia | 1.48 μg |
| Cadmium and thallium | 220 pg |
| Mercury | 2.02 ng |
| Other metals | 26.01 ng |
| Benzo(a)pyrene | 190 pg |
| Dioxins and furans | 27.82 fg |
| PCBs | 243.2 pg |
Weather data is taken from METAR reports from a local airport: London Heathrow.
Upper air data is the latest reported by the Herstmonceux upper air station.
1. SITA CHARLTON LANE ECO PARK AIR QUALITY ASSESSMENT (4th Issue). Fichtner. September 2013.