This page should be read in conjunction with How Plume Plotter Works. It provides more details specific to the Shepperton version of Plume Plotter.
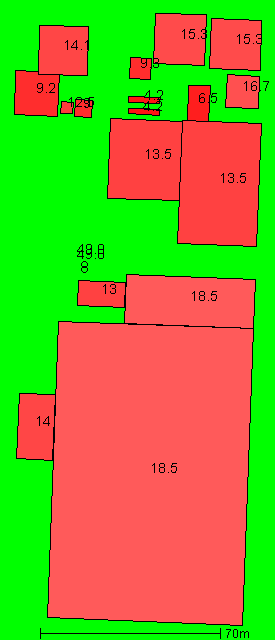
Building measurements are taken from [1]. This image shows the layout of the stacks and buildings modelled. North is at the top; colours and numbers indicate the heights of the buildings and the stacks:
The main stack is for the gasifier. The two gas engine stacks are modelled as a single larger stack, 2 metres north of the gasifier stack.
All of these are taken from [1]:
The following values are used for albedo, Bowen ratio, and roughness length. Roughness length is as specified in [1]:
The emission rates of pollutants are taken from [1]. These are:
| Pollutant | Emission rate per second |
|---|---|
| Oxides of nitrogen | 928 mg |
for the gasifier stack. In addition, the two gas engines have a combined emission rate of 0.572 g/s.
The background levels of pollutants are taken from [1]. These are:
| Pollutant | Background concentration per m3 |
|---|---|
| Oxides of nitrogen | 37.6 μg |
Weather data is taken from METAR reports from a local airport: London Heathrow.
Upper air data is the latest reported by the Herstmonceux upper air station.
1. SITA CHARLTON LANE ECO PARK AIR QUALITY ASSESSMENT (4th Issue). Fichtner. September 2013.