This page should be read in conjunction with How Plume Plotter Works. It provides more details specific to the Usk version of Plume Plotter.
Building measurements are taken from [1], [2], and the aerial photo of the existing site.
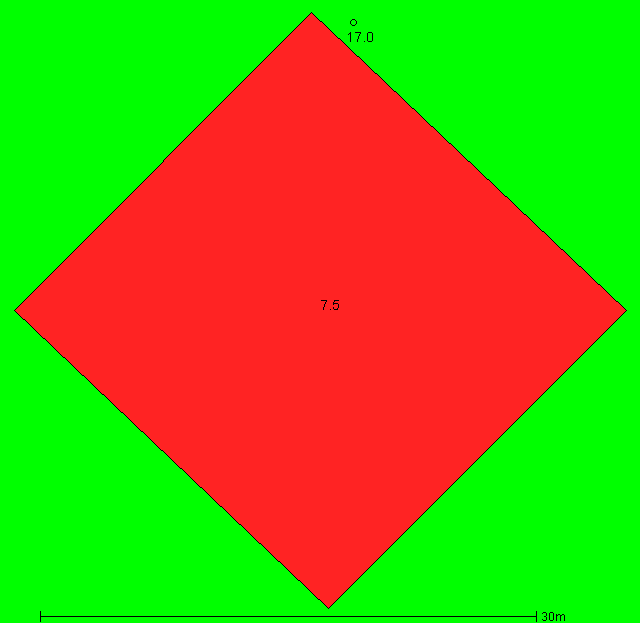
The image below shows the layout of the stack and building modelled. North is at the top; colours and numbers indicate the height of the building and the stack:
These are taken from [1]. Note that the flues are combined into a single stack:
The following values are used for albedo, Bowen ratio and roughness length. None of these are specified in [1]:
The emission rates of pollutants are taken from [1]:
| Pollutant | Emission rate per second |
|---|---|
| Oxides of nitrogen | 1.65 g |
| Particulates PM10 | 12 mg |
| Particulates PM2.5 | 8.5 mg |
| Carbon monoxide | 120 mg |
| TOC | 24 mg |
| Cadmium and thallium | 72 μg |
| Mercury | 72 μg |
| Other metals | 720 μg |
| Dioxins and furans | 140 pg |
| PAHs | 220 ng |
| PCBs | 8.8 pg |
The background levels of pollutants are taken from [1]:
| Pollutant | Background concentration per m3 |
|---|---|
| Oxides of nitrogen | 6.3 μg |
| Particulates PM10 | 12 μg |
| Particulates PM2.5 | 7.3 μg |
| Carbon monoxide | 91 μg |
| TOC | 160 ng |
| Cadmium and thallium | 100 pg |
| Mercury | 1.2 ng |
| Other metals | 12.6 ng |
| Dioxins and furans | 1.5 fg |
| PAHs | 190 pg |
| PCBs | 24 pg |
Weather data is taken from METAR reports from a local airport: Cardiff.
Upper air data is the latest reported by the Camborne upper air station.