This page should be read in conjunction with How Plume Plotter Works. It provides more details specific to the Washington version of Plume Plotter.
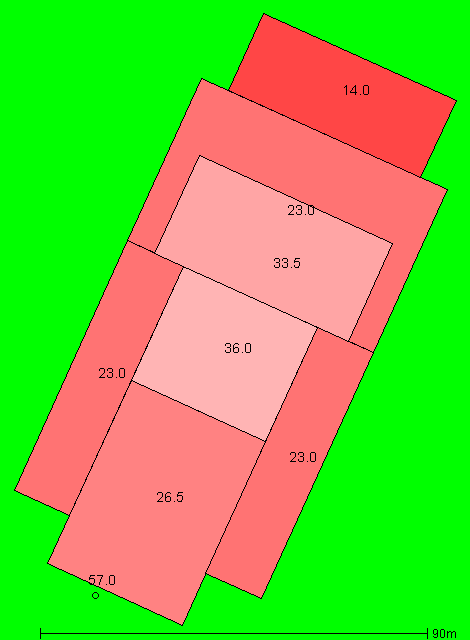
Building measurements are taken from drawings in the planning application (same link as [1] and [2]). We have modelled the incinerator buildings in much more detail than [1]. This image shows the layout of the stack and buildings modelled. North is at the top; colours and numbers indicate the height of buildings and the stack:
All of these are taken from [2]:
The following values are used for albedo, Bowen ratio and roughness length. Roughness length is as specified in [2]:
The emission rates of pollutants are taken from [2]:
| Pollutant | Emission rate per second |
|---|---|
| Oxides of nitrogen | 10.06 g |
| Particulates | 503 mg |
| Sulphur dioxide | 2.51 g |
| Carbon Monoxide | 2.51 g |
| Hydrogen chloride | 503 mg |
| Hydrogen flouride | 50.3 mg |
| Cadmium and thallium | 2.51 mg |
| Mercury | 2.51 mg |
| Other metals | 25.1 mg |
| Ammonia | 503 mg |
| TOC | 503 mg |
| Dioxins and furans | 5.03 ng |
The background levels of pollutants are taken from [1]. These are:
| Pollutant | Background concentration per m3 |
|---|---|
| Oxides of nitrogen | 19.6 μg |
| Particulates | 16.1 μg |
| Sulphur dioxide | 21.8 μg |
| Carbon Monoxide | 169 μg |
| Hydrogen chloride | N/A |
| Hydrogen flouride | N/A |
| Cadmium and thallium | 175 pg |
| Mercury | N/A |
| Other metals | 38.91 ng |
| Ammonia | N/A |
| TOC | 541 ng |
| Dioxins and furans | N/A |
Weather data is taken from METAR reports from a local airport: Newcastle.
Upper air data is the latest reported by the Albemarle upper air station.
1. Environmental Statement: Chapter 5 - Air Quality. Air Quality Consultants Ltd. October 2017.