This page should be read in conjunction with How Plume Plotter Works. It provides more details specific to the Westbury version of Plume Plotter.
Building measurements are taken from [1].
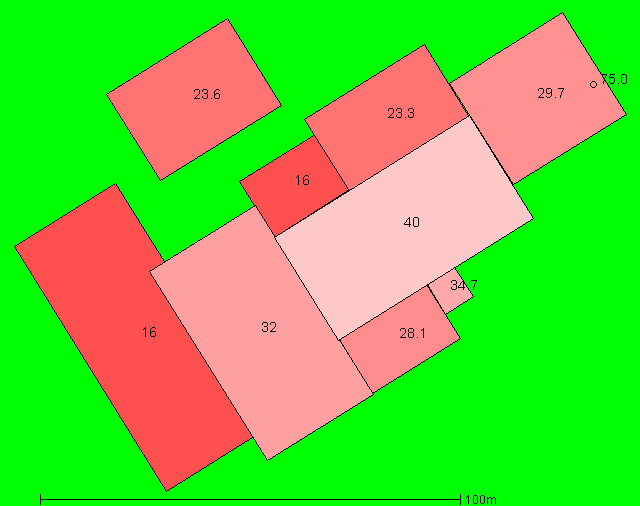
The image below shows the layout of the stack and building modelled. North is at the top; colours and numbers indicate the height of the buildings and the stack:
These are taken from [1]:
The following values are used for albedo, Bowen ratio and roughness length. Roughness length is as specified in [1]:
The emission rates of pollutants are taken from [1]:
| Pollutant | Emission rate per second |
|---|---|
| Oxides of nitrogen | 6.161 g |
| Sulphur dioxide | 1.54 g |
| Carbon monoxide | 2.567 g |
| Particulates | 257 mg |
| Hydrogen chloride | 308 mg |
| TOC | 513 mg |
| Hydrogen flouride | 51 mg |
| Ammonia | 513 mg |
| Cadmium and Thallium | 1.027 mg |
| Mercury | 1.027 mg |
| Other metals | 15.4 mg |
| Dioxins and furans | 3.08 ng |
| PAHs | 5.39 μg |
| PCBs | 257 μg |
The background levels of pollutants are taken from [2]:
| Pollutant | Background concentration per m3 |
|---|---|
| Oxides of nitrogen | 13.19 μg |
| Sulphur dioxide | 2.21 μg |
| Carbon monoxide | 266 μg |
| Particulates | 14.91 μg |
| Hydrogen chloride | 710 ng |
| TOC | 390 ng |
| Hydrogen flouride | 2.35 μg |
| Ammonia | 2.93 μg |
| Cadmium and Thallium | 570 pg |
| Mercury | 2.8 ng |
| Other metals | 141.7 ng |
| Dioxins and furans | 32.99 fg |
| PAHs | 980 pg |
| PCBs | 128.9 pg |
Weather data is taken from METAR reports from a local airport: Bristol.
Upper air data is the latest reported by the Herstmonceux upper air station.
1. Northacre Facility Environmental Statement: Appendix 8.3 - Emissions Modelling. Fichtner. July 2020.
2. Northacre Facility Environmental Statement: Appendix 8.3 - Baseline Analysis. Fichtner. July 2020.