This page should be read in conjunction with How Plume Plotter Works. It provides more details specific to the Alton version of Plume Plotter.
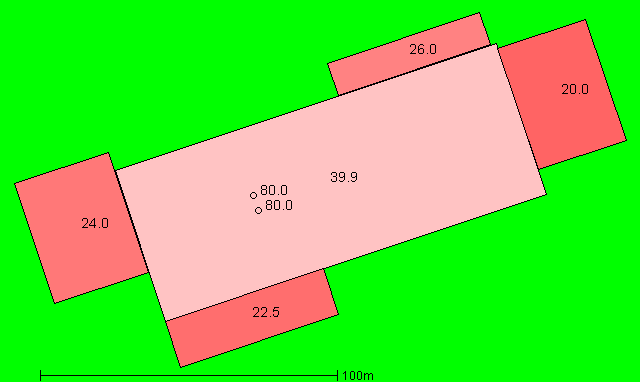
Building measurements are taken from [1]. The image below shows the layout of the stacks and buildings modelled. North is at the top; colours and numbers indicate the height of the buildings and the stack:
All of these are taken from [1]. These only describe one of the stacks. There is a second identical stack 1.7 m east and 5.0 m south of the first one:
The following values are used for albedo, Bowen ratio and roughness length. Roughness length is as specified in [1]:
The emission rates of pollutants (for each stack) were taken from [1], and are listed below:
| Pollutant | Emission rate per second |
|---|---|
| Oxides of nitrogen | 3.733 g |
| Sulphur dioxide | 933 mg |
| Carbon monoxide | 1.555 g |
| Particulates | 156 mg |
| Hydrogen chloride | 187 mg |
| TOC | 311 mg |
| Hydrogen flouride | 31 mg |
| Ammonia | 311 mg |
| Cadmium and thallium | 622 μg |
| Mercury | 622 μg |
| Other metals | 9.332 mg |
| PAHs | 3.266 μg |
| Dioxins and furans | 1.866 ng |
| PCBs | 155.5 μg |
The background levels of pollutants are taken from [1]. These are:
| Pollutant | Background concentration per m3 |
|---|---|
| Oxides of nitrogen | 14.79 μg |
| Sulphur dioxide | 4.93 μg |
| Carbon monoxide | 255 μg |
| Particulates | 15.1 μg |
| Hydrogen chloride | 710 ng |
| TOC | 310 ng |
| Hydrogen flouride | 2.35 μg |
| Ammonia | 2.49 μg |
| Cadmium and thallium | 190 pg |
| Mercury | 1.51 ng |
| Other metals | 24.9 ng |
| PAHs | 160 pg |
| Dioxins and furans | 33 fg |
| PCBs | 127 pg |
Weather data is taken from METAR reports from a local airport: Odiham.
Upper air data is the latest reported by the Herstmonceux upper air station.
1. Alton Advanced Energy Recovery Facility - Appendix 8.3: Emissions Modelling. Fichtner. June 2020.