This page should be read in conjunction with How Plume Plotter Works. It provides more details specific to the Canford version of Plume Plotter.
Building measurements are taken from [1].
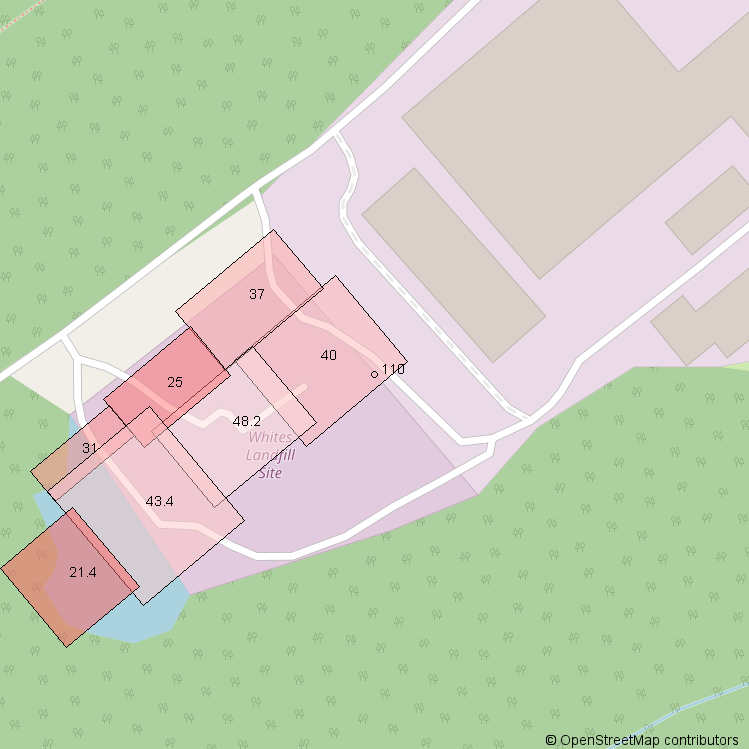
The image below shows the layout of the stack and buildings modelled. North is at the top; colours and numbers indicate the height of the buildings and the stack:
These are taken from [1]:
The following values are used for albedo, Bowen ratio and roughness length. None of these are specified in [1]:
The emission rates of pollutants are taken from [1]:
| Pollutant | Emission rate per second |
|---|---|
| Oxides of nitrogen | 7.5 g |
| Particulates | 310 mg |
| Sulphur dioxide | 1.9 g |
| Carbon monoxide | 3.1 g |
| Hydrogen flouride | 62 mg |
| Hydrogen chloride | 370 mg |
| TOC | 620 mg |
| Dioxins and furans | 2.5 ng |
| Cadmium and Thallium | 1.2 mg |
| Mercury | 1.2 mg |
| Other metals | 19 mg |
| PaHs | 5.6 μg |
| PCBs | 220 pg |
| Ammonia | 310 mg |
The background levels of pollutants are taken from [1]:
| Pollutant | Background concentration per m3 |
|---|---|
| Oxides of nitrogen | 19.6 μg |
| Particulates | 18.7 μg |
| Sulphur dioxide | 6.6 μg |
| Carbon monoxide | 153 μg |
| Hydrogen flouride | 500 ng |
| Hydrogen chloride | 260 ng |
| TOC | 180 ng |
| Dioxins and furans | 3.2 fg |
| Cadmium and Thallium | 110 pg |
| Mercury | N/A |
| Other metals | 12.37 ng |
| PaHs | 78 pg |
| PCBs | 27 pg |
| Ammonia | 1.3 μg |
Weather data is taken from METAR reports from a local airport: Bournemouth.
Upper air data is the latest reported by the Herstmonceux upper air station.