This page should be read in conjunction with How Plume Plotter Works. It provides more details specific to the CF3 version of Plume Plotter.
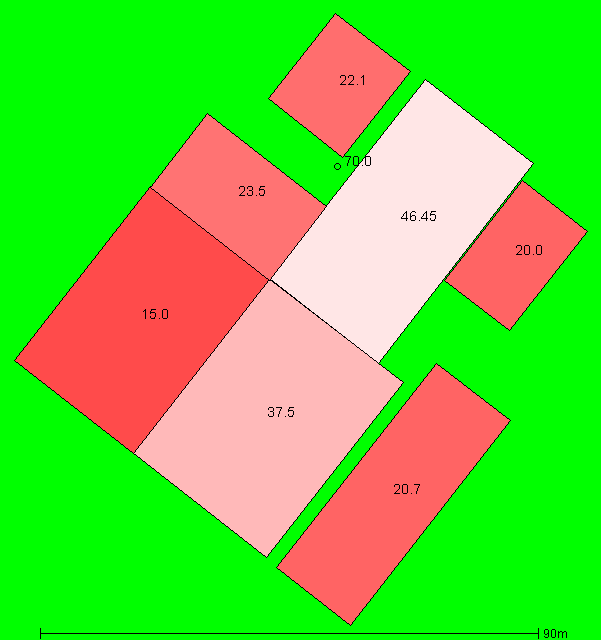
Building measurements are taken from [1]. The image below shows the layout of the stacks and buildings modelled. North is at the top; colours and numbers indicate the height of the buildings and the stack:
All of these are taken from [1]:
The following values are used for albedo, Bowen ratio and roughness length. Roughness length is as specified in [1]:
The emission rates of pollutants (for each stack) were taken from [1], and are listed below:
| Pollutant | Emission rate per second |
|---|---|
| Oxides of nitrogen | 3.762 g |
| Sulphur dioxide | 940 mg |
| Carbon monoxide | 1.567 g |
| Particulates | 157 mg |
| VOCs | 313 mg |
| Hydrogen chloride | 188 mg |
| Hydrogen flouride | 31 mg |
| Cadmium and thallium | 627 μg |
| Mercury | 627 μg |
| Other metals | 9.4 mg |
| Dioxins and furans | 1.25 ng |
The background levels of pollutants are taken from [1], but only particulates and NOx are mentioned. The background levels of other pollutants are taken from the air quality assessment for the nearby incinerator (https://plumeplotter.com/cardiff/howitworks.php).
| Pollutant | Background concentration per m3 |
|---|---|
| Oxides of nitrogen | 12.2 μg |
| Sulphur dioxide | 2.9 μg |
| Carbon monoxide | 354 μg |
| Particulates | 11.7 μg |
| VOCs | 490 ng |
| Hydrogen chloride | 260 ng |
| Hydrogen flouride | 3.5 μg |
| Cadmium and thallium | 230 pg |
| Mercury | 2.3 ng |
| Other metals | 41.92 ng |
| Dioxins and furans | N/A |
Weather data is taken from METAR reports from a local airport: Cardiff.
Upper air data is the latest reported by the Camborne upper air station.