This page should be read in conjunction with How Plume Plotter Works. It provides more details specific to the Consett version of Plume Plotter.
Building measurements are taken from [1].
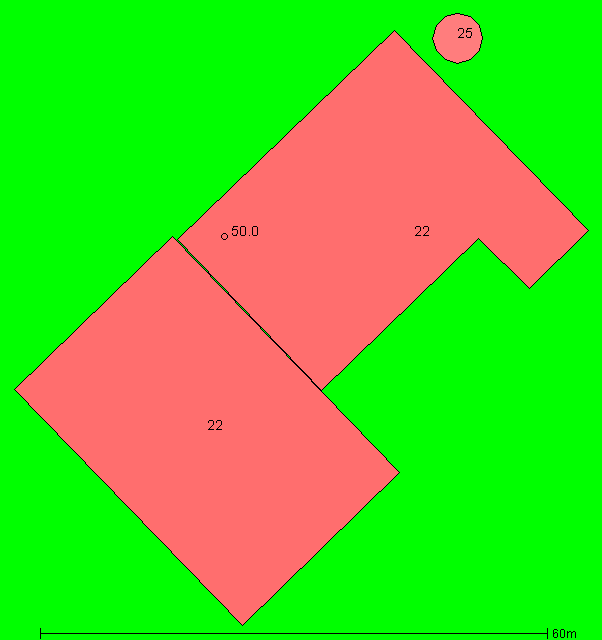
The image below shows the layout of the stack and buildings modelled. North is at the top; colours and numbers indicate the height of the buildings and the stack:
Note that the three gas boilers are not included in the model because they are supposed to operate when the incinerator is not operating, but the plume plotter assumes that the incinerator operates continuously.
These are taken from [1]:
The following values are used for albedo, Bowen ratio and roughness length:
The emission rates of pollutants are taken from [1]:
| Pollutant | Emission rate per second |
|---|---|
| Oxides of nitrogen | 1.14 g |
| Sulphur dioxide | 290 mg |
| Carbon monoxide | 480 mg |
| Particulates | 47 mg |
| Hydrogen chloride | 57 mg |
| TOC | 95 mg |
| Hydrogen flouride | 9 mg |
| Ammonia | 95 mg |
| Cadmium and Thallium | 200 μg |
| Mercury | 94.9 μg |
| Other metals | 2.8 mg |
| PaHs | 1.42 μg |
| Dioxins and furans | 570 pg |
| PCBs | 759 pg |
The background levels of pollutants are taken from [1]:
| Pollutant | Background concentration per m3 |
|---|---|
| Oxides of nitrogen | 20 μg |
| Sulphur dioxide | 3.6 μg |
| Carbon monoxide | 257 μg |
| Particulates | 9.3 μg |
| Hydrogen chloride | 180 ng |
| TOC | 320 ng |
| Hydrogen flouride | N/A |
| Ammonia | 560 ng |
| Cadmium and Thallium | 700 pg |
| Mercury | N/A |
| Other metals | N/A |
| PaHs | 180 pg |
| Dioxins and furans | 11.7 fg |
| PCBs | N/A |
Weather data is taken from METAR reports from a local airport: Newcastle.
Upper air data is the latest reported by the Albemarle upper air station.