This page should be read in conjunction with How Plume Plotter Works. It provides more details specific to the Corby (Shelton) version of Plume Plotter.
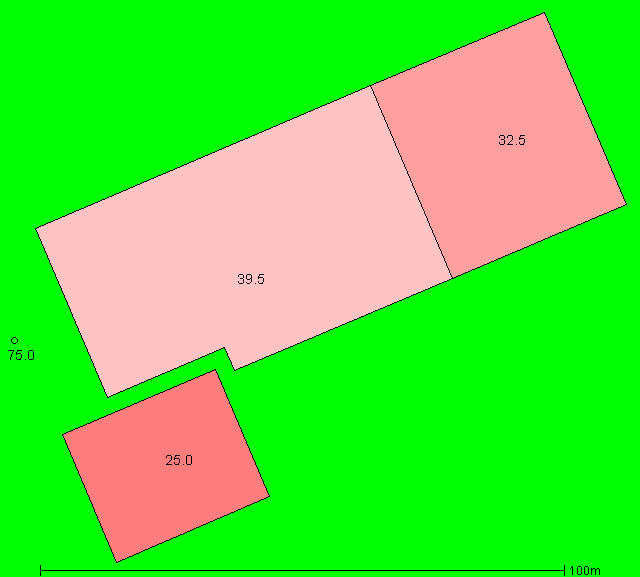
Building measurements are taken from drawings in [2]. The orientation of the buildings is not shown on the plan, so it was assumed to be the same as that of the previously proposed incinerator: perpendicular to Shelton Road. The image below shows the layout of the stack and buildings modelled:
All of these are taken from [1]. The two stacks are modelled as a single larger stack, because of their proximity.
The following values are used for albedo, Bowen ratio and roughness length. These are not specified in [1]:
The emission rates of pollutants are taken from [1]:
| Pollutant | Emission rate per second |
|---|---|
| Oxides of nitrogen | 9.56 g |
| Particulates | 478 mg |
| Sulphur dioxide | 2.38 g |
| Carbon monoxide | 2.38 g |
| Hydrogen chloride | 478 mg |
| Hydrogen flouride | 47.8 mg |
| Cadmium | 2.38 mg |
| Thallium | 2.38 mg |
| Mercury | 23.8 mg |
| Ammonia | 238 mg |
| VOCs | 478 mg |
| PAHs | 4.2 μg |
| Dioxins and furans | 4.78 ng |
The background levels of pollutants are taken from [1]. These are:
| Pollutant | Background concentration per m3 |
|---|---|
| Oxides of nitrogen | 12.5 μg |
| Particulates | 13.6 μg |
| Sulphur dioxide | 4.32 μg |
| Carbon monoxide | 560 μg |
| Hydrogen chloride | 424 ng |
| Hydrogen flouride | 1.23 μg |
| Cadmium | 877 pg |
| Thallium | N/A |
| Mercury | 44.5 pg |
| Ammonia | 2.01 μg |
| VOCs | 342 ng |
| PAHs | 33 pg |
| Dioxins and furans | 9.6 fg |
Weather data is taken from METAR reports from a local airport: Wittering RAF.
Upper air data is the latest reported by the Nottingham upper air station.
1. Shelton Road, Corby Energy Recovery Facility: Environmental Statement. ERM. March 2019.
2. Energy Recovery Centre, Shelton Road: Site Plan. January 2019.