This page should be read in conjunction with How Plume Plotter Works. It provides more details specific to the Crymlyn Burrows version of Plume Plotter.
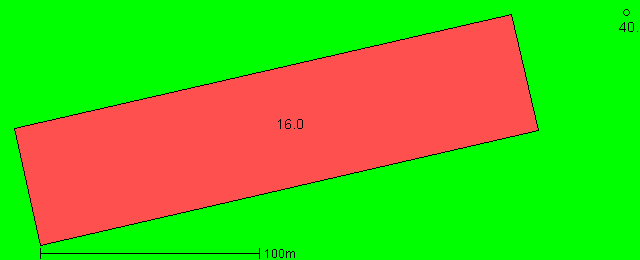
Building measurements are taken from the building plans and aerial photos. This image shows the layout of the stack and buildings modelled. North is at the top; colours and numbers indicate the height of the buildings and the stack.
All of these are taken from [1] except the stack location, which was identified from aerial photos:
The following values are used for albedo, Bowen ratio, and roughness length. Roughness length is as specified in [1]:
The emission rates of pollutants are calculated by multiplying the average emission concentration from the incinerator's emission reports (in 2008) by the normalised flow rate. The latter was estimated as 0.7 times the actual flow rate:
| Pollutant | Emission rate per second |
|---|---|
| Oxides of nitrogen | 1.26 g |
The background levels of pollutants are only estimated:
| Pollutant | Background concentration per m3 |
|---|---|
| Oxides of nitrogen | 18.6 μg |
Weather data is taken from METAR reports from a local airport: Cardiff.
Upper air data is the latest reported by the Camborne upper air station.