

This page should be read in conjunction with How Plume Plotter Works. It provides more details specific to the Drax version of Plume Plotter.
The aim of this plume plotter is to model the Drax power station in a conservative (Drax-friendly) way: i.e., to predict the amount of pollution reaching ground level, but to underestimate the pollution levels whenever there is uncertainty. Of course, like any predictions, these are not guaranteed to be correct and may still overestimate or underestimate the pollution levels because of features of the software (AERMOD) or data or the parameters used.
Drax is a power station with a capacity of 3870 MW (installed capacity 3960 MW) [1] [2] [3], which is 33.994 TWh (34.785 TWh) per year. It has a 259 m stack [1] containing three flues, each with an exit diameter of 9.15 m* [1] [4]. The maximum efflux velocity is 27 m/s and the maximum efflux temperature is 118 °C [4]. The maximum flow rate, derived from this, is 5326 m3/s.
Each flue is connected to two of the six 645MW (660MW) boilers [1] [4]. Therefore, if only one of a flue's two boilers is operational, the maximum efflux velocity for that flue is halved [4]. The efflux velocity is also reduced if boilers are running at less than full load [4].
*Different sources report slightly different values for the parameters (stack diameter 9.1 - 9.15 m; efflux temperature 114 - 118 °C; efflux velocity 26 - 27 m/s). We use the maximum values because they would produce a greater plume rise and hence lower pollution reaching the ground.
To model Drax running at full load, we can simply use the parameters listed in the Stack measurements section below. The only complication is that we do not know the emission rates of pollutants that would be emitted in a hypothetical full load situation. However, we do know the average emission rates, from the actual total emissions for 2016 [5] (listed in the Average emission rates section below). We also know that the gross generation output in 2016 was 19.935 TWh [6] (or 20.8 TWh according to [7]). We can calculate the average 2016 load factor L2016 by dividing the 2016 output (19.935 or 20.8 TWh) by the maximum possible output (33.994 or 34.785 TWh). This gives a value between 0.5731 and 0.6119, so we choose the maximum value: L2016 = 0.6119.
To model Drax at full load we simply divide the 2016 average emission rates by L2016. Because L2016 is an upper bound on the actual load factor, this gives a lower bound on the actual emission rates at full load (assuming a linear relationship between load and emission rates). This will minimise the amounts of pollutants emitted and hence also the amount of pollution reaching ground level.
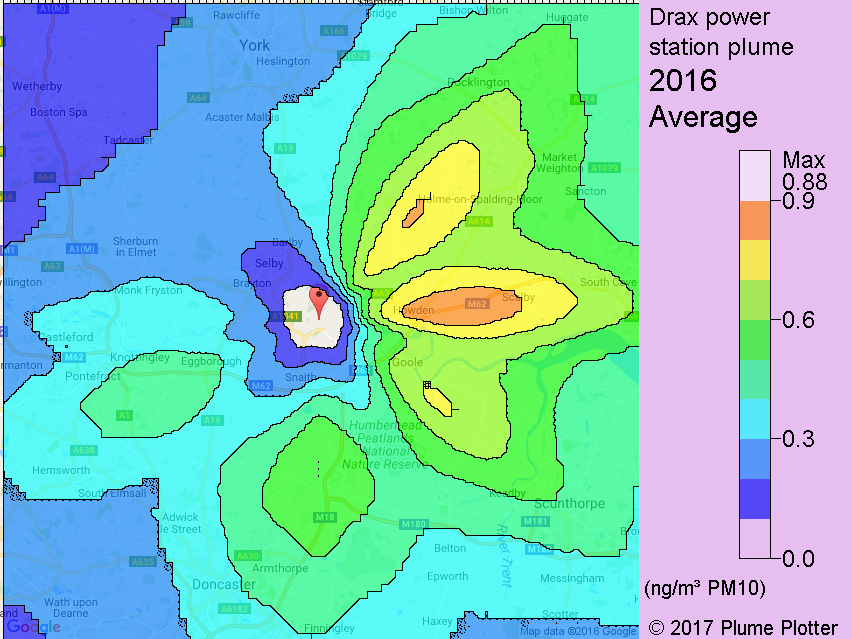
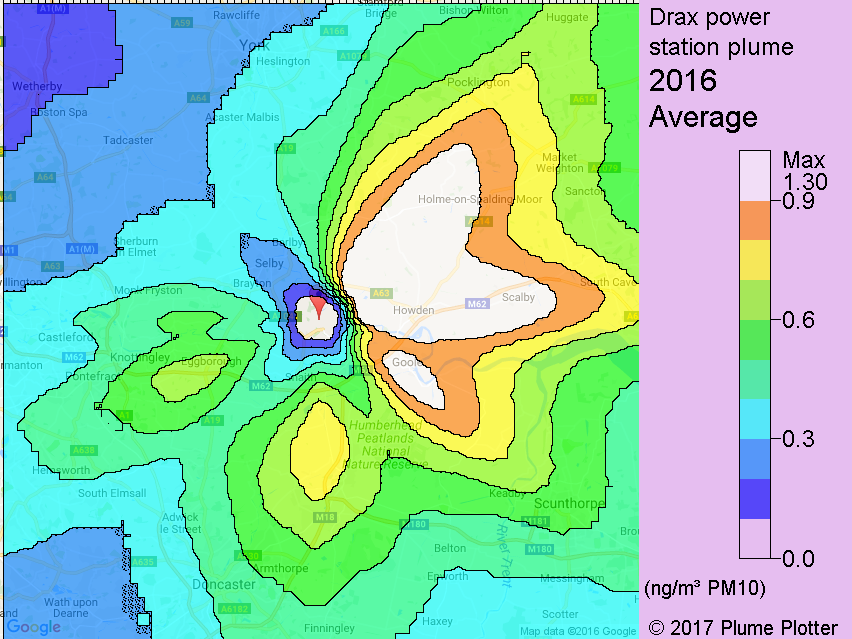
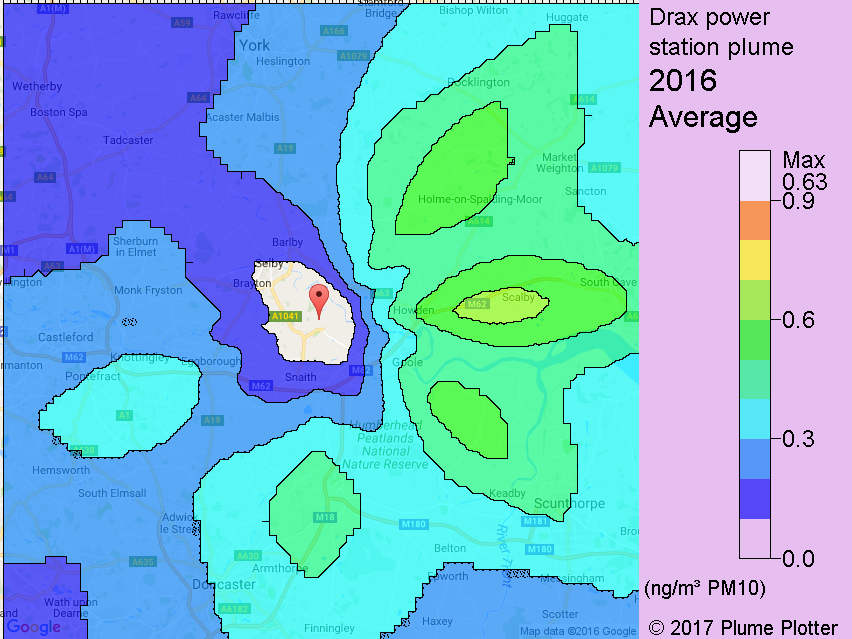
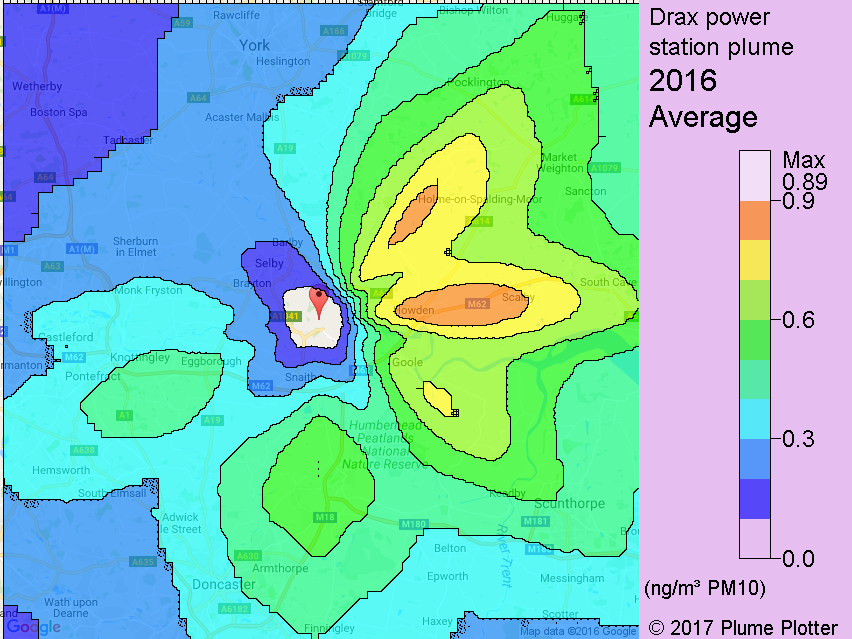
Assuming full load would be unduly pessimistic, so we could instead assume lower emissions at a constant rate. However, if Drax is running at less than full load, there is no way to know how many flues are in use or the efflux velocity in each flue. In principle, these factors determine the plume rise and affect the amount of pollution reaching the ground. Fortunately, at least to some extent, we don't need to know these. The following images show the cumulative plume plot for a year using artificial parameters (see the Validation section below), using two efflux velocities (maximum and half) and using either one or two flues:
| Efflux velocity: | 27 m/s | 13.5 m/s |
|---|---|---|
| 1 flue |  |  |
| 2 flues |  |  |
These images show that plume rise is increased, and fallout reduced, by increasing either the efflux velocity or the number of flues. Less obviously, doubling the number of flues has almost the same effect as doubling the efflux velocity (upper-left and lower-right images). This applies in general (e.g. with three flues at 1/3 velocity the effect is the same), and is presumably because the plume rise in AERMOD is proportional to d2v, as in Holland's 1953 plume rise equation. This means that we can model the plume knowing only the relative flow rate (as a fraction of the maximum 5326 m3/s): we can then multiply either the efflux velocity or the stack cross-sectional area by that fraction. We choose to vary the stack cross-sectional area because it results in very slightly lower fallout than varying the efflux velocity.
In this section, we have assumed that two or three flues can be represented by one stack with two or three times the cross-sectional area of one flue. This is a standard technique for combining nearby flues and stacks, but is supposed to be applied only when the flues are similar. In this case, the flues are identical apart from the flow rates (emission rate and efflux velocity) which we cannot know. The alternative would be to treat the three flues as separate sources, in which case the plume rise would be less and the pollution increased. In order to remain Drax-friendly, we reject this alternative and combine flues instead.
To model average load operations for 2016, we use the known average emission rates (taken directly from the Average emission rates section below) and multiply the (actual physical) combined stack cross-sectional area by L2016 = 0.6119. Because L2016 is an upper bound on the actual load factor, this gives an upper bound on the effective stack area at average load. This will maximise the plume rise and minimise the amount of pollution reaching ground level.
Even assuming an average load would result in over-pessimistic predictions for some of the time. Instead, we should scale the emission rate and the stack cross-sectional area depending on the current power output. Defining the load factor L as the current power output divided by the maximum power output (3870 MW), we multiply the stack cross-sectional area by L and multiply the 2016 average emission rates by L/L2016. (The maximum power output is taken to be 3870 MW because this is the maximum value that the power output can take according to [6].)
The current power output is determined from [11] for real-time plume plots. For historical plots and animation, the historical power output data is taken from [6].
| Stack location: | 53.737166,-0.99903353 | From map and aerial photo |
| Stack height: | 259 m | |
| Stack diameter: | 15.85 m | 3 flues, 9.15m diameter each |
| Stack gas exit velocity: | 27 m/s | |
| Stack gas temperature: | 118 °C |
The emission rates of pollutants are taken from [5]. These are actual values for the whole year 2016, converted to mass per second.
| Pollutant | Emission rate per second |
|---|---|
| Oxides of nitrogen | 463.9 g |
| Particulates PM10 | 32.45 g |
| Sulphur Dioxide | 261 g |
The background levels of pollutants are taken from several sources:
| Pollutant | Background concentration per m3 |
|---|---|
| Oxides of nitrogen | 16.75 μg |
| Particulates PM10 | 14 μg |
| Sulphur Dioxide | 2.296 μg |
The following are taken from studies of incinerators in open countryside:
| Albedo: | 0.2 |
| Bowen ratio: | 1 |
| Roughness length: | 0.0725 |
Tall buildings near an emissions source should be modelled, in case of downwash. In the case of Drax, the only buildings tall enough to be significant are the 12 cooling towers, about 300 m from the stack. We do not model these because (a) they are not very tall (114 m); (b) AERMOD cannot model hollow or cylindrical structures; (c) the cooling towers are not normal buildings because they emit heat and steam and therefore don't have the same effect on the Drax plume. Because of these difficulties, they are omitted completely. Building downwash increases ground-level pollution, so ignoring buildings is consistent with our aim of not overestimating the fallout.
Weather data is taken from METAR reports from a local airport: Leconfield.
For historical plume plots and animations, we use weather data (wind speed, wind direction, temperature, pressure, and cloud cover) from Doncaster Sheffield airport.
Upper air data is the latest reported by the Nottingham upper air station.
The dispersion images (plume plots) shown above do not use real Drax parameters; they use the following:
| Stack height: | 259m | |
| Stack diameter: | 9.1m | (top row) |
| Stack gas exit velocity: | 27 m/s | (left column) |
| Stack gas temperature: | 100 degrees | |
| Emission rate: | 1 g/s | |
| Albedo: | 0.2 | |
| Bowen ratio: | 0.1 | |
| Roughness length: | 0.1 | |
| Weather data: | Heathrow 2016 |
The reason is that these parameters were used for the pseudo-Drax plume plot in [10], except that they used 2012 weather data and albedo and bowen ratio do not apply. Clearly, our top-left plot is very similar to Figure 4 of [10].
1. Drax power station. Wikipedia.
2. Annual review of environmental performance. Drax. 2013.
5. IED AR1 - Emissions Inventory Report. 2016.
6. Actual Generation Output Per Generation Unit. Balancing Mechanism Reporting Service (BMRS).
7. Drax Group plc - Annual report and accounts 2016. Drax. 2016.
8. Modelled background pollution data. DEFRA.
9. Lead, Trace Elements and Industrial Metals data. DEFRA.
10. The potential air quality impacts from biomass combustion. Air Quality Expert Group, DEFRA. 2017.
11. Drax home page.