This page should be read in conjunction with How Plume Plotter Works. It provides more details specific to the East Rockingham version of Plume Plotter.
Building measurements are taken from [1].
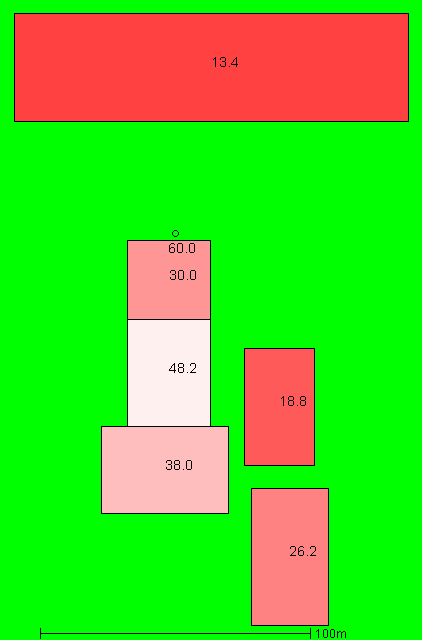
The image below shows the layout of the stack and building modelled. North is at the top; colours and numbers indicate the height of the buildings and the stack:
These are taken from [1]:
The following values are used for albedo, Bowen ratio and roughness length. None of these are specified in [1]:
The emission rates of pollutants are taken from [1]:
| Pollutant | Emission rate per second |
|---|---|
| Oxides of nitrogen | 14.7 g |
| Sulphur dioxide | 3.7 g |
| Carbon monoxide | 3.7 g |
| Particulates | 740 mg |
| Hydrogen chloride | 740 mg |
| Hydrogen flouride | 74 mg |
| TOC | 90 mg |
| Dioxins and furans | 7.4 ng |
| Cadmium and thallium | 730 μg |
| Mercury | 3.68 mg |
| Other metals | 36.77 mg |
The background levels of pollutants are taken from [1]:
| Pollutant | Background concentration per m3 |
|---|---|
| Oxides of nitrogen | 10 μg |
| Sulphur dioxide | 2.7 μg |
| Carbon monoxide | 815 μg |
| Particulates | 15 μg |
| Hydrogen chloride | N/A |
| Hydrogen flouride | N/A |
| TOC | N/A |
| Dioxins and furans | N/A |
| Cadmium and thallium | N/A |
| Mercury | N/A |
| Other metals | N/A |
Weather data is taken from METAR reports from a local airport: Jandakot.
Upper air data is the latest reported by the Perth International Airport upper air station.