This page should be read in conjunction with How Plume Plotter Works. It provides more details specific to the Edmonton version of Plume Plotter.
Building measurements are taken from [2] and confirmed by Figure 2.12 of [3].
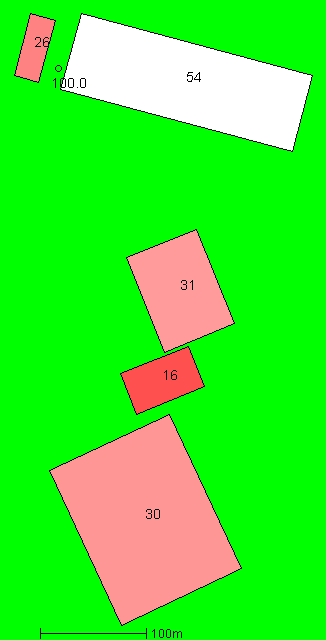
The image below shows the layout of the stack and building modelled. North is at the top; colours and numbers indicate the height of the buildings and the stack:
These are taken from [1] and [2]. Note that the two flues are combined into a single larger stack here:
The following values are used for albedo, Bowen ratio and roughness length. These apply to the weather station (hence the low roughness length). In addition, the URBAN option of AERMOD was used, with an urban roughness length of 1.0 metres, as specified in [2]:
The emission rates of pollutants are taken from [2]:
| Pollutant | Emission rate per second |
|---|---|
| Oxides of nitrogen | 10.84 g |
| Carbon monoxide | 6.78 g |
| TOC | 1.36 g |
| Ammonia | 140 mg |
| Particulates | 1.36 g |
| Hydrogen chloride | 1.36 g |
| Hydrogen flouride | 140 mg |
| Sulphur dioxide | 6.78 g |
| Cadmium and thallium | 7 mg |
| Mercury | 7 mg |
| Other metals | 68 mg |
| Dioxins and furans | 14 ng |
The background levels of pollutants are taken from [1]:
| Pollutant | Background concentration per m3 |
|---|---|
| Oxides of nitrogen | 31.9 μg |
| Carbon monoxide | 600 μg |
| TOC | 200 ng |
| Ammonia | 3.1 μg |
| Particulates | 23.4 μg |
| Hydrogen chloride | 380 ng |
| Hydrogen flouride | N/A |
| Sulphur dioxide | 6.7 μg |
| Cadmium and thallium | 210 pg |
| Mercury | 2.4 ng |
| Other metals | 63 ng |
| Dioxins and furans | 33.7 fg |
Weather data is taken from METAR reports from a local airport: London City.
Upper air data is the latest reported by the Herstmonceux upper air station.