This page should be read in conjunction with How Plume Plotter Works. It provides more details specific to the Elean version of Plume Plotter.
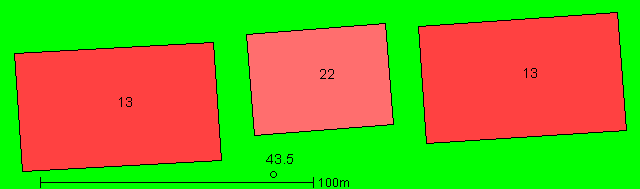
Building measurements are taken from the planning application. This image shows the layout of the stack and buildings modelled. North is at the top; colours and numbers indicate the height of the buildings and the stack.
Most of these details were supplied by the Environment Agency:
The following values are used for albedo, Bowen ratio and roughness length:
The emission rates of pollutants are the actual emission rates for 2015, taken from the National Atmospheric Emissions Inventory. They are listed below:
| Pollutant | Emission rate per second |
|---|---|
| Carbon dioxide | 44.08 g |
| Carbon monoxide | 34.47 g |
| Sulphur dioxide | 6.837 g |
| Oxides of nitrogen | 6.725 g |
| Hydrogen chloride | 764.5 mg |
| VOCs | 211.3 mg |
| PM10 | 541.7 mg |
| PM2.5 | 464.9 mg |
| PM1 | 190.2 mg |
| PM0.1 | 52.57 mg |
| Lead | 1.753 mg |
| Zinc | 1.608 mg |
| Copper | 160.8 μg |
| Nickel | 160.8 μg |
| Chromium | 160.8 μg |
| Arsenic | 16.08 μg |
| Cadmium | 16.08 μg |
| Mercury | 15.79 μg |
| Dioxins | 840.3 pg |
The background levels of pollutants are taken from a recent air quality assessment for a planned incinerator at Waterbeach:
| Pollutant | Background concentration per m3 |
|---|---|
| Carbon dioxide | N/A |
| Carbon monoxide | N/A |
| Sulphur dioxide | N/A |
| Oxides of nitrogen | 15.08 μg |
| Hydrogen chloride | N/A |
| VOCs | N/A |
| PM10 | N/A |
| PM2.5 | N/A |
| PM1 | N/A |
| PM0.1 | N/A |
| Lead | N/A |
| Zinc | N/A |
| Copper | N/A |
| Nickel | N/A |
| Chromium | N/A |
| Arsenic | N/A |
| Cadmium | N/A |
| Mercury | N/A |
| Dioxins | N/A |
Weather data is taken from METAR reports from a local airport: RAF Lakenheath.
Upper air data is the latest reported by the Nottingham upper air station.