This page should be read in conjunction with How Plume Plotter Works. It provides more details specific to the Ford version of Plume Plotter.
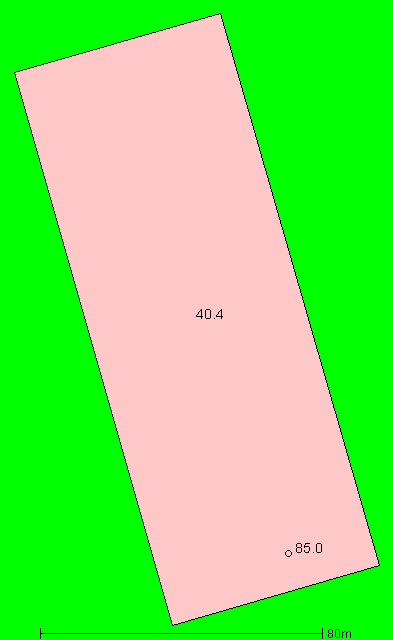
Building measurements are taken from [1]. The image below shows the layout of the stacks and buildings modelled. North is at the top; colours and numbers indicate the height of the buildings and the stack:
All of these are taken from [1]:
The following values are used for albedo, Bowen ratio and roughness length. Roughness length is as specified in [1]:
The emission rates of pollutants were taken from [1], and are listed below:
| Pollutant | Emission rate per second |
|---|---|
| Oxides of nitrogen | 6.456 g |
| Sulphur dioxide | 1.614 g |
| Carbon monoxide | 2.69 g |
| Particulates | 269 mg |
| Hydrogen chloride | 323 mg |
| TOC | 538 mg |
| Hydrogen flouride | 54 mg |
| Ammonia | 538 mg |
| Cadmium and thallium | 1.076 mg |
| Mercury | 1.076 mg |
| Other metals | 16.14 mg |
| PAHs | 5.649 μg |
| Dioxins and furans | 3.228 ng |
| PCBs | 269 μg |
The background levels of pollutants are taken from [2]. These are:
| Pollutant | Background concentration per m3 |
|---|---|
| Oxides of nitrogen | 20.71 μg |
| Sulphur dioxide | 6.89 μg |
| Carbon monoxide | 265 μg |
| Particulates | 16.11 μg |
| Hydrogen chloride | 710 ng |
| TOC | 360 ng |
| Hydrogen flouride | 2.35 μg |
| Ammonia | 3.41 μg |
| Cadmium and thallium | 260 pg |
| Mercury | 3.69 ng |
| Other metals | 55.89 ng |
| PAHs | 330 pg |
| Dioxins and furans | 33 fg |
| PCBs | 127 pg |
Weather data is taken from METAR reports from a local airport: Shoreham.
Upper air data is the latest reported by the Herstmonceux upper air station.