This page should be read in conjunction with How Plume Plotter Works. It provides more details specific to the Hirwaun version of Plume Plotter.
Building measurements are taken from [1].
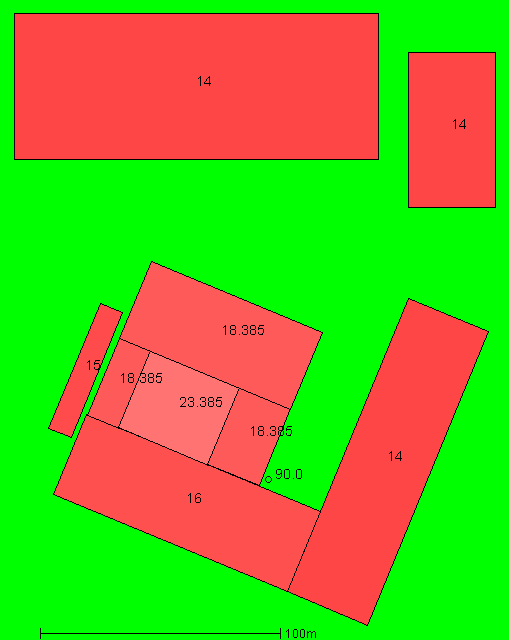
The image below shows the layout of the stack and buildings modelled. North is at the top; colours and numbers indicate the height of the buildings and the stack:
These are taken from [1], with the three flues combined into a single emission source:
The following values are used for albedo, Bowen ratio and roughness length:
The emission rates of pollutants are taken from [1]:
| Pollutant | Emission rate per second |
|---|---|
| Oxides of nitrogen | 2.205 g |
| Sulphur dioxide | 552 mg |
| Carbon monoxide | 2.757 g |
| Particulates | 275.7 mg |
| TOC | 552 mg |
| Hydrogen chloride | 275.7 mg |
| Hydrogen flouride | 55.2 mg |
| Cadmium and Thallium | 1.104 mg |
| Mercury | 1.104 mg |
| Other metals | 16.53 mg |
| Ammonia | 27.57 mg |
| Dioxins and furans | 2.205 ng |
| PCBs | 3.3 ng |
| PAHs | 55.2 μg |
The background levels of pollutants are taken from [1]:
| Pollutant | Background concentration per m3 |
|---|---|
| Oxides of nitrogen | 6.158 μg |
| Sulphur dioxide | 2.79 μg |
| Carbon monoxide | 97.9 ng |
| Particulates | 10.34 μg |
| TOC | 161.6 ng |
| Hydrogen chloride | 185 ng |
| Hydrogen flouride | N/A |
| Cadmium and Thallium | 285 pg |
| Mercury | 21.7 pg |
| Other metals | 24.97 ng |
| Ammonia | 1.239 μg |
| Dioxins and furans | 4.575 fg |
| PCBs | 22.2 pg |
| PAHs | 252 pg |
Weather data is taken from METAR reports from a local airport: Cardiff.
Upper air data is the latest reported by the Camborne upper air station.