This page should be read in conjunction with How Plume Plotter Works. It provides more details specific to the Killoch version of Plume Plotter.
Building measurements are taken from [1].
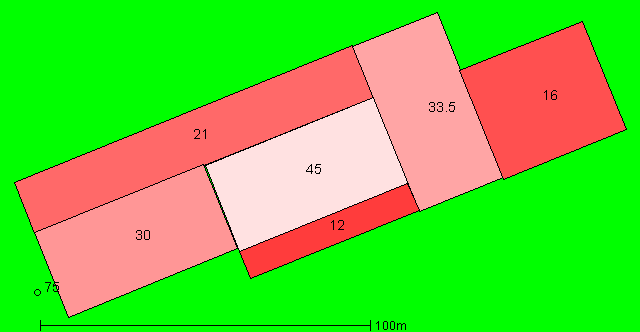
The image below shows the layout of the stack and buildings modelled. North is at the top; colours and numbers indicate the height of the buildings and the stack:
These are taken from [1]:
The following values are used for albedo, Bowen ratio and roughness length:
The emission rates of pollutants are taken from [1]:
| Pollutant | Emission rate per second |
|---|---|
| Oxides of nitrogen | 3.663 g |
| Sulphur dioxide | 916 mg |
| Carbon monoxide | 1.526 g |
| Particulates | 153 mg |
| Hydrogen chloride | 183 mg |
| TOC | 305 mg |
| Hydrogen flouride | 31 mg |
| Ammonia | 305 mg |
| Cadmium and Thallium | 611 μg |
| Mercury | 611 μg |
| Other metals | 9.158 mg |
| PaHs | 6.105 μg |
| Dioxins and furans | 1.831 ng |
| PCBs | 153 μg |
The background levels of pollutants are taken from [2]:
| Pollutant | Background concentration per m3 |
|---|---|
| Oxides of nitrogen | 4.79 μg |
| Sulphur dioxide | 3.38 μg |
| Carbon monoxide | 177 μg |
| Particulates | 11.08 μg |
| Hydrogen chloride | 710 ng |
| TOC | 230 ng |
| Hydrogen flouride | 2.35 μg |
| Ammonia | 3.18 μg |
| Cadmium and Thallium | 570 pg |
| Mercury | 2.8 ng |
| Other metals | 130.4 ng |
| PaHs | 980 pg |
| Dioxins and furans | 32.99 fg |
| PCBs | 128.9 pg |
Weather data is taken from METAR reports from a local airport: Prestwick.
Upper air data is the latest reported by the Albemarle upper air station.
1. Killoch ERP - Appendix 8.4 - Process Emissions Modelling. Fichtner. March 2021.
2. Killoch ERP - Appendix 8.3 - Baseline Analysis. Fichtner. February 2021.