This page should be read in conjunction with How Plume Plotter Works. It provides more details specific to the Lara/Geelong version of Plume Plotter.
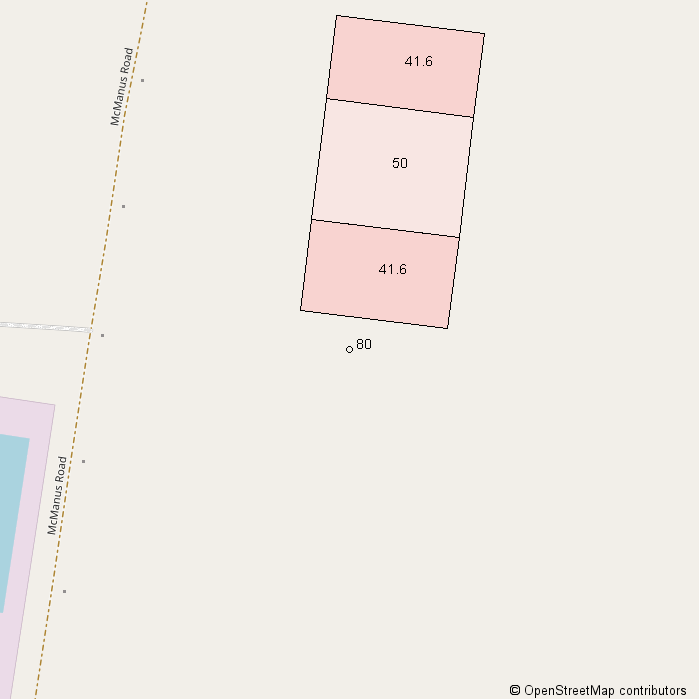
The stack and buildings were included in the model as described in [1]. However, the heights of the buildings were taken from the elevation drawings in [2], which are slightly different. The image below shows the layout of the stack and buildings modelled. North is at the top; colours and numbers indicate the height of the buildings and the stack:
These are taken from [1]:
The following values are used for albedo, Bowen ratio and roughness length. None of these are specified in [1]:
The emission rates of pollutants are taken from [1]:
| Pollutant | Emission rate per second |
|---|---|
| Oxides of nitrogen | 9.93 g |
| Particulates | 414 mg |
| TVOC | 828 mg |
| Hydrogen chloride | 496.8 mg |
| Hydrogen flouride | 82.8 mg |
| Sulphur dioxide | 2.484 g |
| Carbon monoxide | 4.14 g |
| Cadmium and thallium | 1.656 mg |
| Other metals | 24.84 mg |
| Mercury | 1.656 mg |
The background levels of pollutants are the averages for 2022 for Geelong South [3], except for the concentration of HF, which is taken from [1]:
| Pollutant | Background concentration per m3 |
|---|---|
| Oxides of nitrogen | 4.95 μg |
| Particulates | 17.38 μg |
| TVOC | N/A |
| Hydrogen chloride | N/A |
| Hydrogen flouride | 100 ng |
| Sulphur dioxide | 343.5 ng |
| Carbon monoxide | 154.6 ng |
| Cadmium and thallium | N/A |
| Other metals | N/A |
| Mercury | N/A |
Weather data is taken from METAR reports from a local airport: Avalon.
Upper air data is the latest reported by the Melbourne Airport upper air station.