This page should be read in conjunction with How Plume Plotter Works. It provides more details specific to the Loughborough version of Plume Plotter.
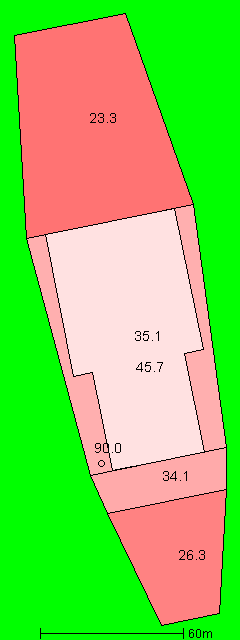
Building measurements are taken from [2]. This image shows the layout of the stack and buildings modelled. (Because of its strange shape, the single building has to be modelled as a number of flat-roofed polygonal buildings.) North is at the top; colours and numbers indicate the height of the buildings and the stack. Note that the highest building (35.1m high) has an even higher tier (45.7m) on top:
These are taken from [1]:
The following values are used for albedo and Bowen ratio, while roughness length varies with wind direction. This is all as specified in [1]:
The emission rates of pollutants are taken from [1]:
| Pollutant | Emission rate per second |
|---|---|
| Oxides of nitrogen | 17.86 g |
| Particulates | 890 mg |
| Sulphur dioxide | 4.47 g |
| Carbon monoxide | 4.47 g |
| Hydrogen chloride | 890 mg |
| Hydrogen flouride | 89 mg |
| TOC | 890 mg |
| Cadmium & Thallium | 4.47 mg |
| Mercury | 4.47 mg |
| Other metals | 44.65 mg |
| Ammonia | 890 mg |
| Dioxins and furans | 8.93 ng |
| PAHs | N/A |
| PCBs | N/A |
The background levels of pollutants are taken from [1]:
| Pollutant | Background concentration per m3 |
|---|---|
| Oxides of nitrogen | 27.3 μg |
| Particulates | 19.5 μg |
| Sulphur dioxide | 2.5 μg |
| Carbon monoxide | 166.2 μg |
| Hydrogen chloride | 200 ng |
| Hydrogen flouride | 3.5 μg |
| TOC | 400 ng |
| Cadmium & Thallium | 100 pg |
| Mercury | 1.5 ng |
| Other metals | 15.2 ng |
| Ammonia | 3.06 μg |
| Dioxins and furans | N/A |
| PAHs | N/A |
| PCBs | N/A |
Weather data is taken from METAR reports from a local airport: East Midlands.
Upper air data is the latest reported by the Nottingham upper air station.
1. NEWHURST ENERGY RECOVERY FACILITY -- Air Emissions Risk Assessment. SLR. May 2018.