This page should be read in conjunction with How Plume Plotter Works. It provides more details specific to the Newtownabbey version of Plume Plotter.
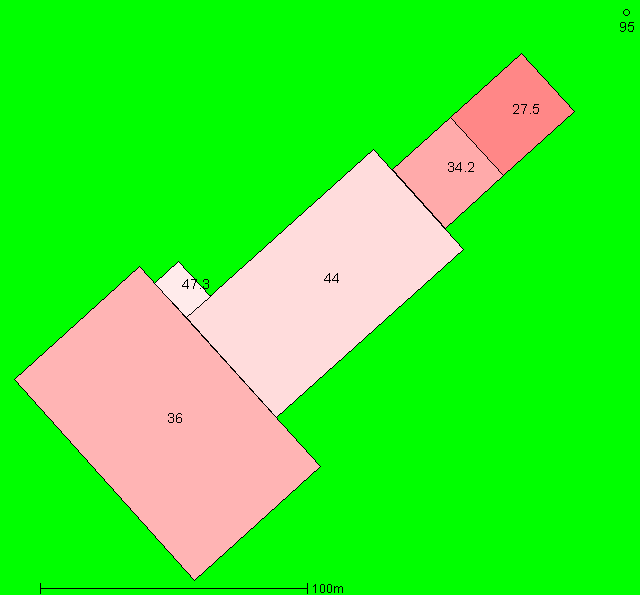
Building measurements are taken from [1] and [2]. This image shows the layout of the stack and building modelled. North is at the top; colours and numbers indicate the height of the buildings and the stack.
All of these are taken from [1]:
The following values are used for albedo, Bowen ratio, and roughness length, as specified in [1] and [2]:
The emission rates of pollutants are taken from [1] and [2]. These are:
| Pollutant | Emission rate per second |
|---|---|
| Particulates PM10 | 388.9 mg |
| VOCs | 388.9 mg |
| Ammonia | 388.9 mg |
| Hydrogen chloride | 388.9 mg |
| Hydrogen flouride | 38.9 mg |
| Sulphur dioxide | 1.944 g |
| Oxides of nitrogen | 7.778 g |
| Carbon monoxide | 1.944 g |
| Cadmium and thallium | 1.9 mg |
| Mercury | 1.9 mg |
| Other metals | 19.4 mg |
| Dioxins and furans | 3.889 ng |
The background levels of pollutants are taken from [1] and [2]. These are:
| Pollutant | Background concentration per m3 |
|---|---|
| Particulates PM10 | 10.8 μg |
| VOCs | 562 ng |
| Ammonia | 4.95 μg |
| Hydrogen chloride | 280 ng |
| Hydrogen flouride | 2.35 μg |
| Sulphur dioxide | 340 ng |
| Oxides of nitrogen | 4.4 μg |
| Carbon monoxide | 184 μg |
| Cadmium and thallium | 80 pg |
| Mercury | 1.6 ng |
| Other metals | 11.35 ng |
| Dioxins and furans | N/A |
Weather data is taken from METAR reports from a local airport: Belfast.
Upper air data is the latest reported by the Castor Bay upper air station.