This page should be read in conjunction with How Plume Plotter Works. It provides more details specific to the Omagh version of Plume Plotter.
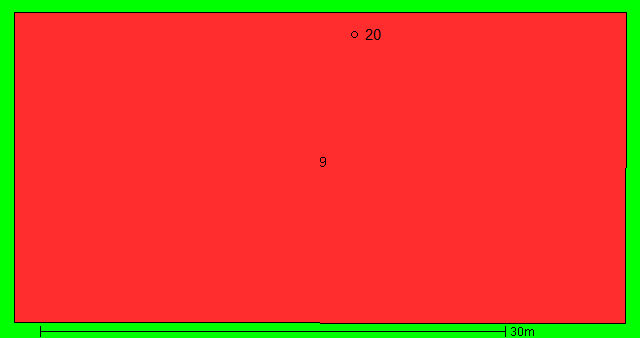
Building measurements are taken from [2]. This image shows the layout of the stack and building modelled. North is at the top; colours and numbers indicate the height of the building and the stack.
These are taken from [1]:
The following values are used for site characteristics. Roughness length is as specified in [1]:
The emission rates of pollutants are taken from [1]:
| Pollutant | Emission rate per second |
|---|---|
| Oxides of nitrogen | 540 mg |
| Carbon monoxide | 130 mg |
| Particulates | 30 mg |
| VOC | 30 mg |
| Hydrogen chloride | 30 mg |
Background levels of some pollutants are specified in [1]:
| Pollutant | Background concentration per m3 |
|---|---|
| Oxides of nitrogen | 2.95 μg |
| Carbon monoxide | N/A |
| Particulates | 6.51 μg |
| VOC | N/A |
| Hydrogen chloride | N/A |
Weather data is taken from METAR reports from a local airport: Belfast.
Upper air data is the latest reported by the Castor Bay upper air station.
1. AIR QUALITY ASSESSMENT - OMAGH INCINERATOR. Irwin Carr Consulting. March 2023.
2. Plans, Maps and Drawings - Omagh Waste Energy Plant. 2018-2020.