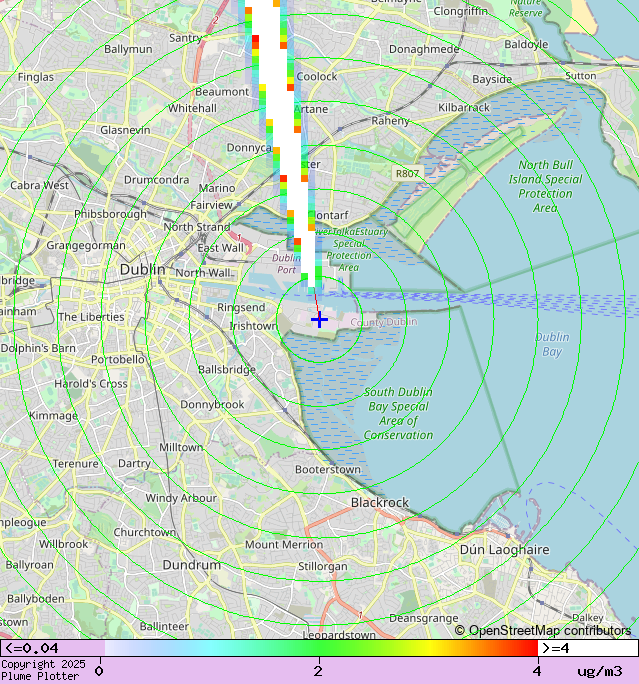
The map shows the predicted distribution of pollution. The key below the map shows the predicted concentration of the main pollutant at each location.
The text shows the maximum concentration of the main pollutant in the map area.
DETAILS shows maximum concentrations of all pollutants in the map area, compared with the existing background concentrations.
MORE DETAILS shows concentrations of all pollutants in more detail (in a new window).
The plume is modelled using Planned emission rates (e.g., from the planning application) or Historical emission rates (from emissions reports for a recent year).
The map can be zoomed in or out and can be Centred on the source or Downwind from the source.
The latest weather information is obtained automatically. Reload the page to update the plume.
Snapshot shows the current plume plot as a single image.
Animation shows an animated plume plot covering the latest 24 hours.
1g = 1000mg, 1mg = 1000µg, 1µg = 1000ng, 1ng = 1000pg, 1pg = 1000fg.