This page should be read in conjunction with How Plume Plotter Works. It provides more details specific to the Portland version of Plume Plotter.
Building measurements are taken from [1].
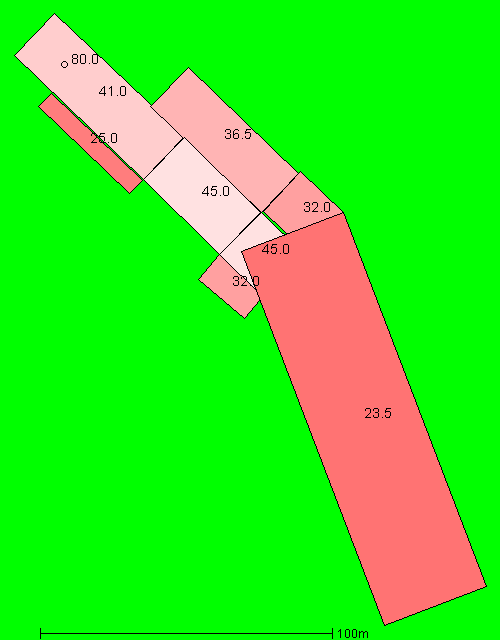
The image below shows the layout of the stack and buildings modelled. North is at the top; colours and numbers indicate the height of the buildings and the stack:
These are taken from [1]:
The following values are used for albedo, Bowen ratio and roughness length. None of these are specified in [1]:
The emission rates of pollutants are taken from [1]:
| Pollutant | Emission rate per second |
|---|---|
| Oxides of nitrogen | 4.689 g |
| Sulphur dioxide | 1.172 g |
| Carbon monoxide | 1.954 g |
| Particulates | 195 mg |
| Hydrogen chloride | 234 mg |
| VOCs | 391 mg |
| Hydrogen flouride | 39 mg |
| Ammonia | 391 mg |
| Cadmium and Thallium | 781 μg |
| Mercury | 781 μg |
| Other metals | 11.72 mg |
| PAHs | 4.103 μg |
| Dioxins and furans | 2.344 ng |
| PCBs | 4.103 μg |
The background levels of pollutants are taken from [1]:
| Pollutant | Background concentration per m3 |
|---|---|
| Oxides of nitrogen | 22.01 μg |
| Sulphur dioxide | 3.32 μg |
| Carbon monoxide | 209 μg |
| Particulates | 14.74 μg |
| Hydrogen chloride | 710 ng |
| VOCs | 270 ng |
| Hydrogen flouride | 2.35 μg |
| Ammonia | 820 ng |
| Cadmium and Thallium | 570 pg |
| Mercury | 2.8 ng |
| Other metals | 124.4 ng |
| PAHs | 980 pg |
| Dioxins and furans | 32.99 fg |
| PCBs | 129 pg |
Weather data is taken from METAR reports from a local airport: Bournemouth.
Upper air data is the latest reported by the Herstmonceux upper air station.