This page should be read in conjunction with How Plume Plotter Works. It provides more details specific to the Preston version of Plume Plotter.
Building measurements are taken from [2].
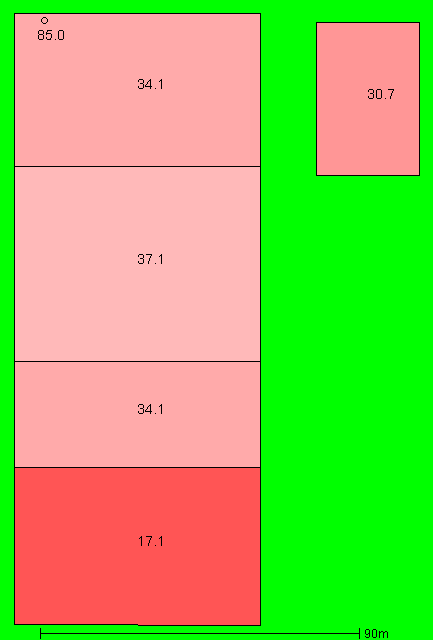
The image below shows the layout of the stack and building modelled. North is at the top; colours and numbers indicate the height of the buildings and the stack:
These are taken from [2]. Note that the two flues are combined into a single larger stack here:
The following values are used for albedo, Bowen ratio and roughness length. Roughness length is as specified in [2]:
The emission rates of pollutants are taken from [2]:
| Pollutant | Emission rate per second |
|---|---|
| Oxides of nitrogen | 10.57 g |
| Sulphur dioxide | 2.64 g |
| Carbon monoxide | 4.4 g |
| Particulates | 440 mg |
| Hydrogen chloride | 530 mg |
| VOCs | 880 mg |
| Hydrogen flouride | 90 mg |
| Ammonia | 880 mg |
| Cadmium and thallium | 2 mg |
| Mercury | 2 mg |
| Other metals | 30 mg |
| PAHs | 9.25 μg |
| Dioxins and furans | 5.28 ng |
| PCBs | 440 μg |
The background levels of pollutants are taken from [1]:
| Pollutant | Background concentration per m3 |
|---|---|
| Oxides of nitrogen | 26.19 μg |
| Sulphur dioxide | 4.45 μg |
| Carbon monoxide | 392 μg |
| Particulates | 14.58 μg |
| Hydrogen chloride | 710 ng |
| VOCs | 1.07 μg |
| Hydrogen flouride | 2.35 μg |
| Ammonia | 4.13 μg |
| Cadmium and thallium | 830 pg |
| Mercury | 20.1 ng |
| Other metals | 95.13 ng |
| PAHs | 490 pg |
| Dioxins and furans | 33 fg |
| PCBs | 127.5 pg |
Weather data is taken from METAR reports from a local airport: Blackpool.
Upper air data is the latest reported by the Nottingham upper air station.