This page should be read in conjunction with How Plume Plotter Works. It provides more details specific to the Rookery version of Plume Plotter.
Building measurements are taken from [1].
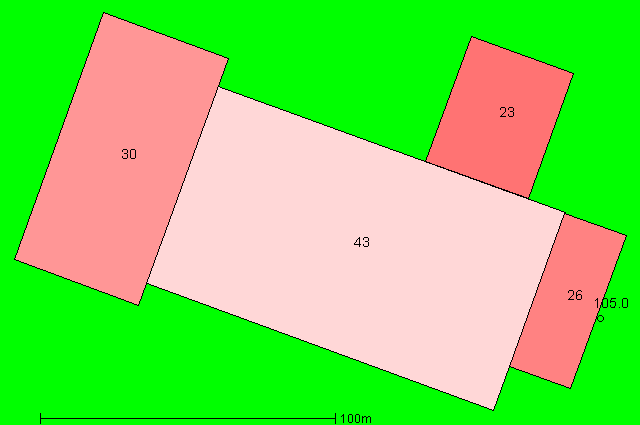
This image shows the layout of the stack and buildings modelled:
All of these are taken from [1]:
The following values are used for albedo, Bowen ratio and roughness length. The value of roughness length is as specified in [1]:
The emission rates of pollutants are taken from [1]. These are:
| Pollutant | Emission rate per second |
|---|---|
| Oxides of nitrogen | 25.86 g |
| Sulphur dioxide | 6.465 g |
| Carbon monoxide | 6.465 g |
| Particulates | 1.293 g |
| Hydrogen chloride | 1.293 g |
| TOC | 1.293 g |
| Hydrogen flouride | 129.3 mg |
| Ammonia | 1.293 g |
| Cadmium and thallium | 6.465 mg |
| Mercury | 6.465 mg |
| Other metals | 64.65 mg |
| PaHs | 13.58 μg |
| Dioxins and furans | 12.93 ng |
| PCBs | 646.5 μg |
The background levels of pollutants are taken from [1]. These are:
| Pollutant | Background concentration per m3 |
|---|---|
| Oxides of nitrogen | 23.55 μg |
| Sulphur dioxide | 4.26 μg |
| Carbon monoxide | 332 μg |
| Particulates | 19.8 μg |
| Hydrogen chloride | 710 ng |
| TOC | 670 ng |
| Hydrogen flouride | 2.35 μg |
| Ammonia | 2.87 μg |
| Cadmium and thallium | 120 pg |
| Mercury | 880 pg |
| Other metals | 18.11 ng |
| PaHs | 1.119 ng |
| Dioxins and furans | 33 fg |
| PCBs | 119.5 ng |
Weather data is taken from METAR reports from a local airport: Luton.
Upper air data is the latest reported by the Herstmonceux upper air station.
1. COVANTA -- ROOKERY SOUTH ENERGY RECOVERY FACILITY -- AIR QUALITY ASSESSMENT. Fichtner. October 2016.