

This page should be read in conjunction with How Plume Plotter Works. It provides more details specific to the Ryburn Valley version of Plume Plotter.
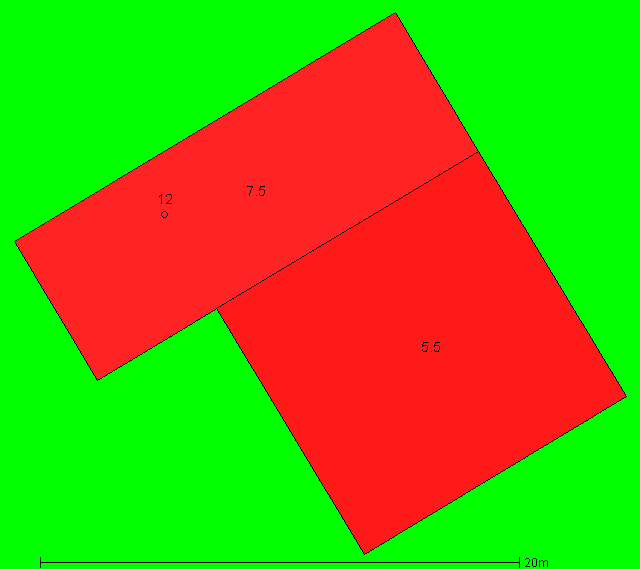
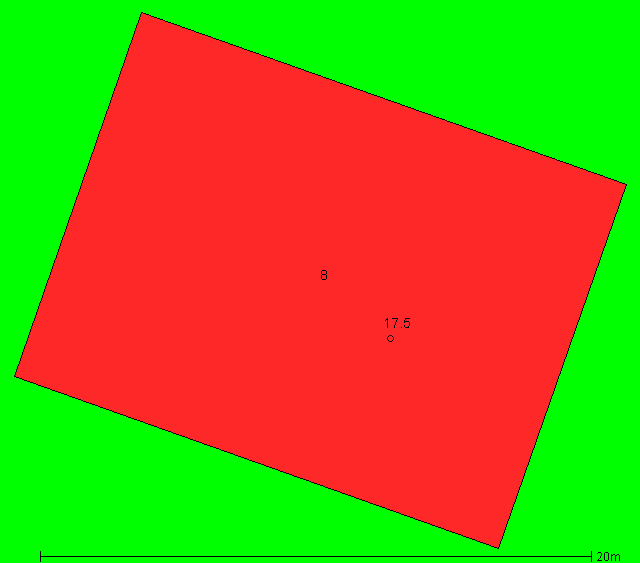
Building measurements are taken from [2] and [4].
The first image below shows the layout of the stacks and buildings modelled at both incinerators.
The second image shows the layout of the stack and buildings modelled at the Rochdale Road incinerator. North is at the top. Numbers show the heights of buildings and stacks, in metres. Higher buildings are a lighter shade of pink.
The third image shows the layout of the stack and buildings modelled at the Mearclough Road incinerator.


Details of the Rochdale Road incinerator (elevation 85.1m) are taken from [1]:
Details of the Mearclough Road incinerator (elevation 75.5m) are taken from [3]:
The following values are used for albedo, Bowen ratio, and roughness length. None of these are specified in [1]:
Both incinerators are expected to operate 5 days/week. We assume that they operate continuously, but to ensure that the annual means are correct, we multiply the emission rates by 5/7.
For the Rochdale Road incinerator, the emission rates of pollutants are taken from [1]:
| Pollutant | Emission rate per second |
|---|---|
| Oxides of nitrogen | 180 mg |
| Particulates | 9.1 mg |
| TOC | 9.1 mg |
| Hydrogen chloride | 9.1 mg |
| Hydrogen flouride | 910 μg |
| Carbon monoxide | 46 mg |
| Sulphur dioxide | 46 mg |
| Cadmium and thallium | 45.6 μg |
| Mercury | 45.6 μg |
| Other metals | 456 μg |
| Dioxins and furans | 91.3 pg |
| PAHs | 913 ng |
| PCBs | 4.56 μg |
The emission rates of the Mearclough Road incinerator are the same as the above, multiplied by 0.14/0.18 [3].
The background levels of pollutants are taken from [1] and [3]. These are:
| Pollutant | Background concentration per m3 |
|---|---|
| Oxides of nitrogen | 16.4 μg |
| Particulates | 14.4 μg |
| TOC | 320 ng |
| Hydrogen chloride | 310 ng |
| Hydrogen flouride | 500 ng |
| Carbon monoxide | 131 μg |
| Sulphur dioxide | 4.1 μg |
| Cadmium and thallium | 100 pg |
| Mercury | 1.2 ng |
| Other metals | 12.61 ng |
| Dioxins and furans | 8 fg |
| PAHs | 62 pg |
| PCBs | 44 pg |
Wind speed, wind direction, temperature, pressure, and solar radiation are the latest values reported by one of two weather stations. If a value is not available from the primary weather station it is obtained from the secondary weather station. (Some weather stations do not measure solar radiation at all.) The primary weather station is and the secondary weather station is .
Upper air data is the latest reported by the Nottingham upper air station.
1. Proposed Waste Recovery Plant, Rochdale Road, Sowerby Bridge: Air Quality Assessment. Entran Ltd. September 2015. Planning application 17/00113/WAM, document "17_00113_WAM-AIR_QUALITY-1006369.PDF".
2. Environmental Statement Volume 2. Sol Environment Ltd. January 2017. Planning application 17/00113/WAM, document "17_00113_WAM-ENVIROMENTAL_STATEMENT_2-1006378.pdf".