This page should be read in conjunction with How Plume Plotter Works. It provides more details specific to the SELCHP version of Plume Plotter.
Building measurements were obtained from aerial photographs and a planning application dating from 2009.
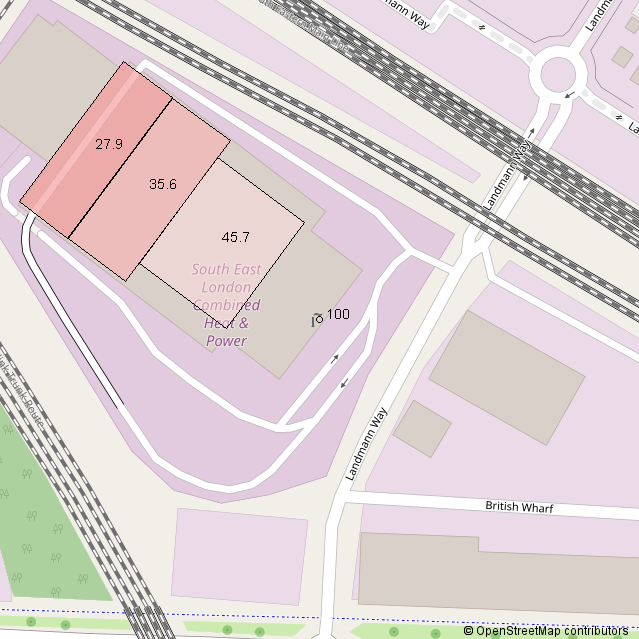
The image below shows the layout of the stack and buildings modelled, overlaid on a map. North is at the top; colours and numbers indicate the height of the buildings and the stack:
The stack location was obtained from aerial photographs. The other parameters below were taken from [1] and [4]. We have combined the two flues into one larger flue because (a) they are close enough to combine and (b) emission rates are only known for the whole incinerator, not for each flue. The combined flue has the same area as the sum of the two real flues. We have used the exit velocity and temperature from [4] but the values in [1] are very similar (22.3 m/s and 149.5°C).
The following values are used for albedo, Bowen ratio and roughness length.
The urban option of AERMOD was used, with an urban population of 8 million and urban roughness length of 1 m.
The emission rates of pollutants were calculated from the 2019 Pollution Inventory [2] and the incinerator's annual performance report for 2019. We divided the amounts of pollutants emitted for the whole year (from [2]) by the number of hours in the year that the incinerator was operational. The number of hours used (8198) is the average for the two flues (8280 and 8116). The plume plotter uses the resulting emission rate (in g/s), and assumes that the incinerator is operating continuously (8760 hours/year), as the plume plotter does.
| Pollutant | Emission rate per second |
|---|---|
| Oxides of nitrogen | 19.2 g |
| Particulates | 117.6 mg |
| Hydrogen chloride | 917 mg |
| Ammonia | 430 mg |
| Chromium | 1.675 mg |
| Copper | 529.3 μg |
| Nickel | 379.8 μg |
| Mercury | 137.6 μg |
| Arsenic | 86.4 μg |
| Cadmium | 79.97 μg |
The background levels of pollutants were taken from the air quality assessment for the South London incinerator, which is some distance away.
| Pollutant | Background concentration per m3 |
|---|---|
| Oxides of nitrogen | 30 μg |
| Particulates | 25 μg |
| Hydrogen chloride | 1 μg |
| Ammonia | 3 μg |
| Chromium | N/A |
| Copper | N/A |
| Nickel | N/A |
| Mercury | 2 ng |
| Arsenic | N/A |
| Cadmium | N/A |
Weather data is taken from METAR reports from a local airport: London City.
Upper air data is the latest reported by the Herstmonceux upper air station.
2. Pollution Inventory. Environment Agency. 2019.
3. Annual Performance Report 2020 [actually 2019]. January 2020.