This page should be read in conjunction with How Plume Plotter Works. It provides more details specific to the Slough version of Plume Plotter.
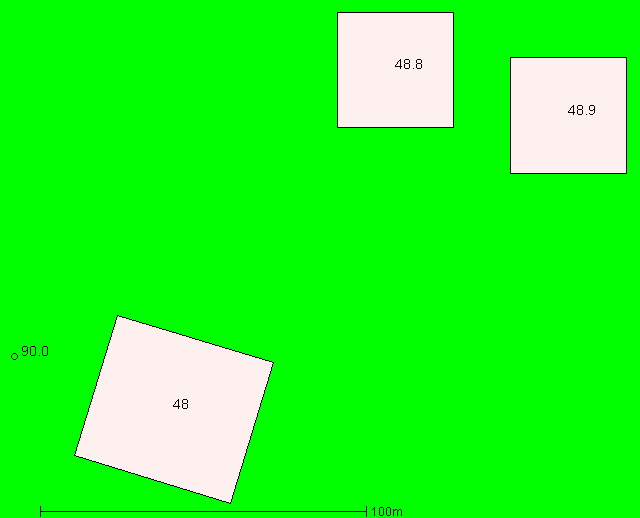
Building measurements are taken from [1]. This image shows the layout of the stack and buildings modelled. North is at the top; colours and numbers indicate the heights of the buildings and the stack:
All of these are taken from [1]:
The following values are used for albedo, Bowen ratio, and roughness length. Roughness length is as specified in [1]:
The emission rates of pollutants are taken from [1]. These are:
| Pollutant | Emission rate per second |
|---|---|
| Oxides of nitrogen | 21.02 g |
| Sulphur dioxide | 5.25 g |
| Particulates | 1.05 g |
| Carbon monoxide | 5.25 g |
| Hydrogen chloride | 1.05 g |
| Hydrogen flouride | 105 mg |
| VOC | 1.05 g |
| Ammonia | 560 mg |
| Cadmium and thallium | 5.6 mg |
| Mercury | 5.6 mg |
| Other metals | 56 mg |
The background levels of pollutants are taken from [1]. These are:
| Pollutant | Background concentration per m3 |
|---|---|
| Oxides of nitrogen | 31 μg |
| Sulphur dioxide | 3.9 μg |
| Particulates | 16.9 μg |
| Carbon monoxide | 196 μg |
| Hydrogen chloride | 350 ng |
| Hydrogen flouride | 3 ng |
| VOC | N/A |
| Ammonia | N/A |
| Cadmium and thallium | 160 pg |
| Mercury | N/A |
| Other metals | 127.1 ng |
Weather data is taken from METAR reports from a local airport: London Heathrow.
Upper air data is the latest reported by the Herstmonceux upper air station.