This page should be read in conjunction with How Plume Plotter Works. It provides more details specific to the Swadlincote version of Plume Plotter.
Building measurements are taken from [1].
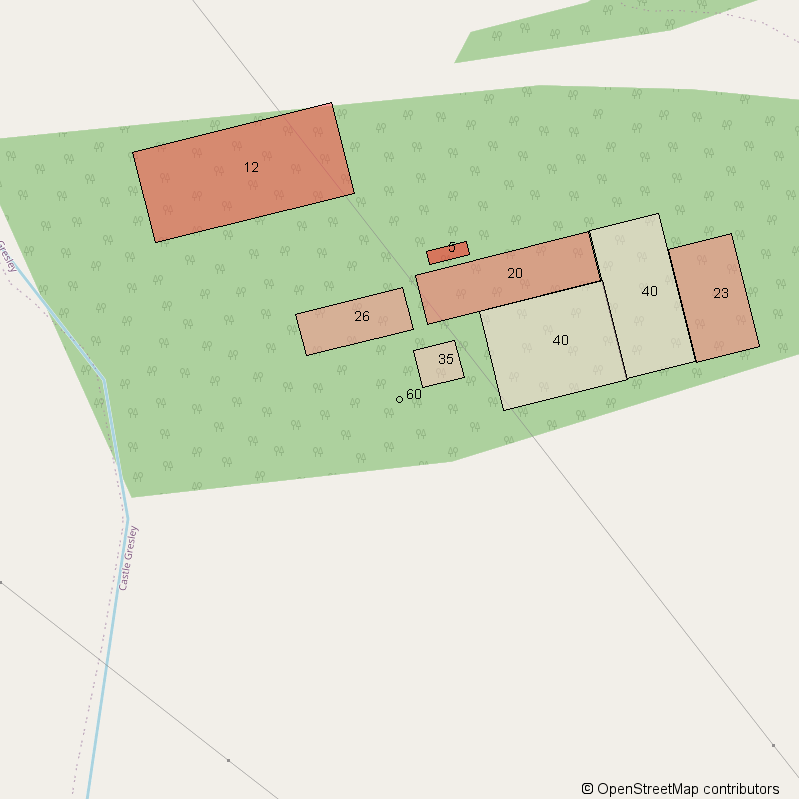
The image below shows the layout of the stack and buildings modelled. North is at the top; colours and numbers indicate the height of the buildings and the stack:
Note that the emergency generator is not included in the model because it is supposed to operate when the incinerator is not operating, but the plume plotter assumes that the incinerator operates continuously.
These are taken from [1]:
The following values are used for albedo, Bowen ratio and roughness length:
The emission rates of pollutants are taken from [1]:
| Pollutant | Emission rate per second |
|---|---|
| Oxides of nitrogen | 5.77 g |
| Particulates | 240 mg |
| Sulphur dioxide | 1.44 g |
| Carbon monoxide | 2.4 g |
| TOC | 480 mg |
| Hydrogen chloride | 288 mg |
| Hydrogen flouride | 48 mg |
| Cadmium and thallium | 960 μg |
| Mercury | 480 μg |
| Other metals | 14 mg |
| Ammonia | 480 mg |
| Dioxins and furans | 2.88 ng |
| PAH | 7.21 μg |
| PCB | 3.84 ng |
The background levels of pollutants are taken from [1]:
| Pollutant | Background concentration per m3 |
|---|---|
| Oxides of nitrogen | 18.9 μg |
| Particulates | 14 μg |
| Sulphur dioxide | 2.6 μg |
| Carbon monoxide | 341 μg |
| TOC | 620 ng |
| Hydrogen chloride | 210 ng |
| Hydrogen flouride | N/A |
| Cadmium and thallium | 300 pg |
| Mercury | N/A |
| Other metals | 116.4 ng |
| Ammonia | 3.58 μg |
| Dioxins and furans | 11.7 fg |
| PAH | 250 pg |
| PCB | N/A |
Weather data is taken from a local synoptic weather station: Nottingham Watnall.
Upper air data is the latest reported by the Nottingham upper air station.