This page should be read in conjunction with How Plume Plotter Works. It provides more details specific to the WTE Araucanía version of Plume Plotter.
Building measurements are taken from a plan (p40) and a drawing (p4) that appear in [1].
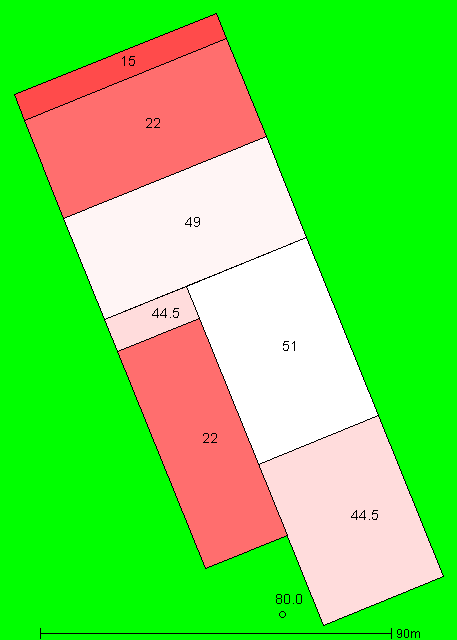
The image below shows the layout of the stack and building modelled. North is at the top; colours and numbers indicate the height of the buildings and the stack:
These are taken from [1] and [2]:
The following values are used for albedo, Bowen ratio and roughness length. These are as specified in [3], except that we use the same values for all wind directions:
The emission rates of pollutants are taken from [4]:
| Pollutant | Emission rate per second |
|---|---|
| Óxidos de nitrógeno (NOx) | 8.207 g |
| Dióxido de azufre (SO2) | 2.05 g |
| Monóxido de carbono (CO) | 2.05 g |
| Material particulado (MP) | 410 mg |
| Carbono orgánico total (COT) | 410 mg |
| Ácido clorhídrico (HCl) | 410 mg |
| Ácido fluorhídrico (HF) | 41 mg |
| Cadmio (Cd) | 2 mg |
| Mercurio (Hg) | 2 mg |
| Otros metales | 20 mg |
| Dioxinas y furanos | 4.1 ng |
The background levels of pollutants are taken from [5]:
| Pollutant | Background concentration per m3 |
|---|---|
| Óxidos de nitrógeno (NOx) | 13.21 μg |
| Dióxido de azufre (SO2) | 2.24 μg |
| Monóxido de carbono (CO) | 1.578 mg |
| Material particulado (MP) | 30.21 μg |
| Carbono orgánico total (COT) | N/A |
| Ácido clorhídrico (HCl) | N/A |
| Ácido fluorhídrico (HF) | N/A |
| Cadmio (Cd) | N/A |
| Mercurio (Hg) | N/A |
| Otros metales | N/A |
| Dioxinas y furanos | N/A |
Weather data is taken from METAR reports from a local airport: La Araucanía.
Upper air data is the latest reported by the Puerto Montt upper air station.
1. Estudio de Impacto Ambiental: Planta WTE Araucanía -- Adenda, BioAqua. August 2019.
2. Adenda EIA -- Planta WTE Araucanía -- Partes, acciones y obras físicas, BioAqua. August 2019.