This page should be read in conjunction with How Plume Plotter Works. It provides more details specific to the Waterbeach version of Plume Plotter.
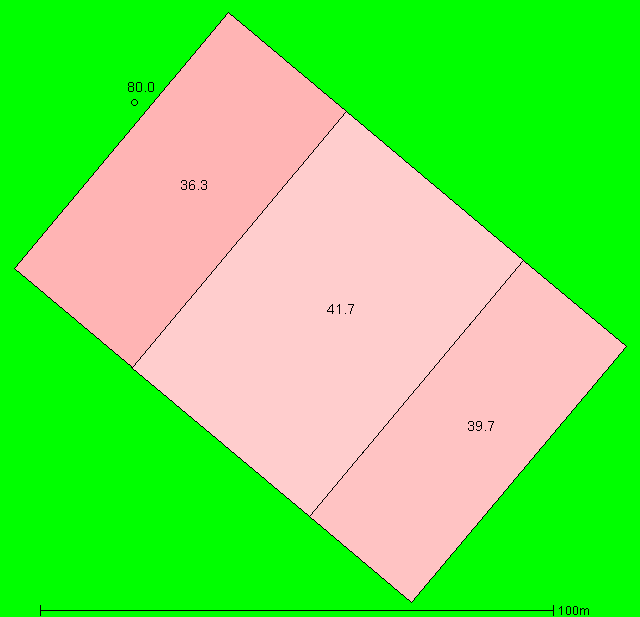
Building measurements are taken from [2]. This image shows the layout of the stack and building modelled. North is at the top; colours and numbers indicate the height of the buildings and the stack:
These are taken from [2]. Note that the two flues are combined into a single larger stack here:
The following values are used for albedo, Bowen ratio and roughness length. Roughness length is as specified in [2]:
The emission rates of pollutants are taken from [2]:
| Pollutant | Emission rate per second |
|---|---|
| Oxides of nitrogen | 10.7 g |
| Sulphur dioxide | 2.676 g |
| Carbon monoxide | 2.676 g |
| Particulates | 535.1 mg |
| Hydrogen chloride | 535.1 mg |
| VOC | 535.1 mg |
| Hydrogen flouride | 53.51 mg |
| Ammonia | 535.1 mg |
| Mercury | 2.676 mg |
| Cadmium and thallium | 2.676 mg |
| Other metals | 26.76 mg |
| Dioxins and furans | 5.351 ng |
| Benzo(a)pyrene | 11.23 μg |
| PCBs | 267.6 μg |
The background levels of pollutants are taken from [1]:
| Pollutant | Background concentration per m3 |
|---|---|
| Oxides of nitrogen | 15.08 μg |
| Sulphur dioxide | 8.67 μg |
| Carbon monoxide | 315 μg |
| Particulates | 18.36 μg |
| Hydrogen chloride | 710 ng |
| VOC | 400 ng |
| Hydrogen flouride | 2.35 μg |
| Ammonia | 2.9 μg |
| Mercury | 2.43 ng |
| Cadmium and thallium | 300 pg |
| Other metals | 30.09 ng |
| Dioxins and furans | 33 fg |
| Benzo(a)pyrene | 140 pg |
| PCBs | 127.5 pg |
Weather data is taken from METAR reports from a local airport: Cambridge.
Upper air data is the latest reported by the Nottingham upper air station.
1. Environmental Statement V3 App 8.1: Baseline Review. Fichtner. October 2017.
2. Environmental Statement V3 App 8.2: Process Emissions Modelling. Fichtner. December 2017.