|
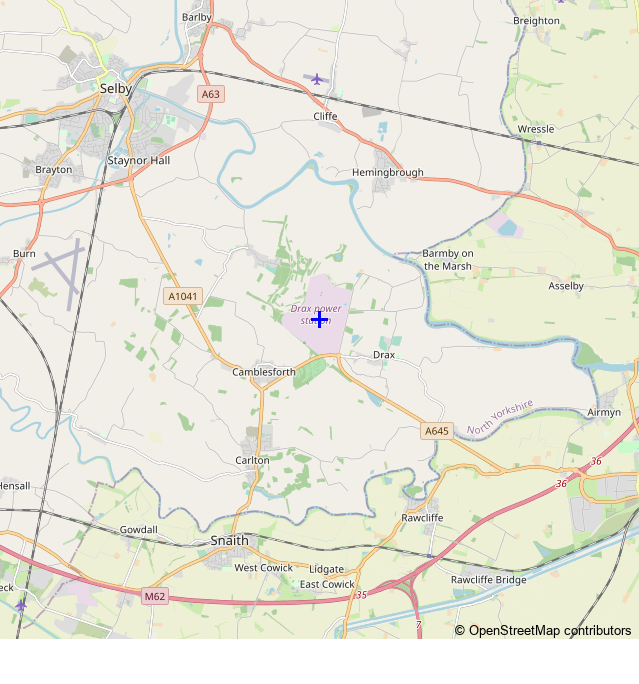
The map shows the (predicted) current state of pollution from the power station at Selby, North Yorkshire. Unrealistically assumes a fixed load factor: 0.6119 Why? The red line shows wind direction. Green rings show distance (km). Colours show concentration of particulates PM10 at ground level. Maximum: 1.59 ng/m3. This is the concentration at the location that is most polluted by the plume. Breakdown of pollutants at most polluted location (green = background, red = added by plume): Oxides of nitrogen
Particulates PM10
Sulphur Dioxide
Oxides of nitrogen
Particulates PM10
Sulphur Dioxide
The emission rates were reported at 00:20 on Sun, 13 Jul 2025. As well as the toxic pollutants in the plume, carbon dioxide (CO2) is currently being emitted at a rate of 553 kilograms per second. (How is this calculated?) Each hour this is 1990 tonnes, equivalent to a volume of approximately 1006336 cubic metres, which is enough to fill 2013 typical houses. See here for an explanation of how these CO2 emissions are accounted for.
| |||||||||||||||||||||||||||||||||||||||||||||||||||||